After months of work and four months in beta testing and refinement, we are proud to announce the official release of our New Dashboards. Dashboards have been completely rewritten to provide snappier visualization, multiple and shared dashboards, customizable default dashboards, faster performance, more filters, and an updated look. Here's a rundown of the changes.
New Functionality
- Multiple Dashboards - Create a dashboard for your own navigation. Create one for the indicators that matter to you. Then create one for things that matter to your project team, or your executive board. Each will appear in your Dashboard View as a separate tab.
- Nameable Dashboards - Name them what you want. Click and drag to reorder, as with browser tabs.
- Shareable Dashboards - Once you create a dashboard that you like for your project, team, or department, you can then share this dashboard. Sharing your dashboard makes it so that other users can see it and display it in their own Dashboard View (like Saved Pito reports). They will not be able to edit your dashboard if it's shared--they can only edit it by making a copy!
- Push Dashboards to Other Users - Do you have a dashboard that would be great for your executive team to see, but you don't want to make them manually add it themselves? You can push that dashboard directly to them. Note: this action requires the new Dashboard Manager permissions role.
- Only Show a Subset of your Dashboards - You can create as many dashboards as you want, but you don't have to have them all displayed all the time. This is particularly useful for those of you who create dashboards for other teams or users. Simply click the X and choose Hide when prompted.
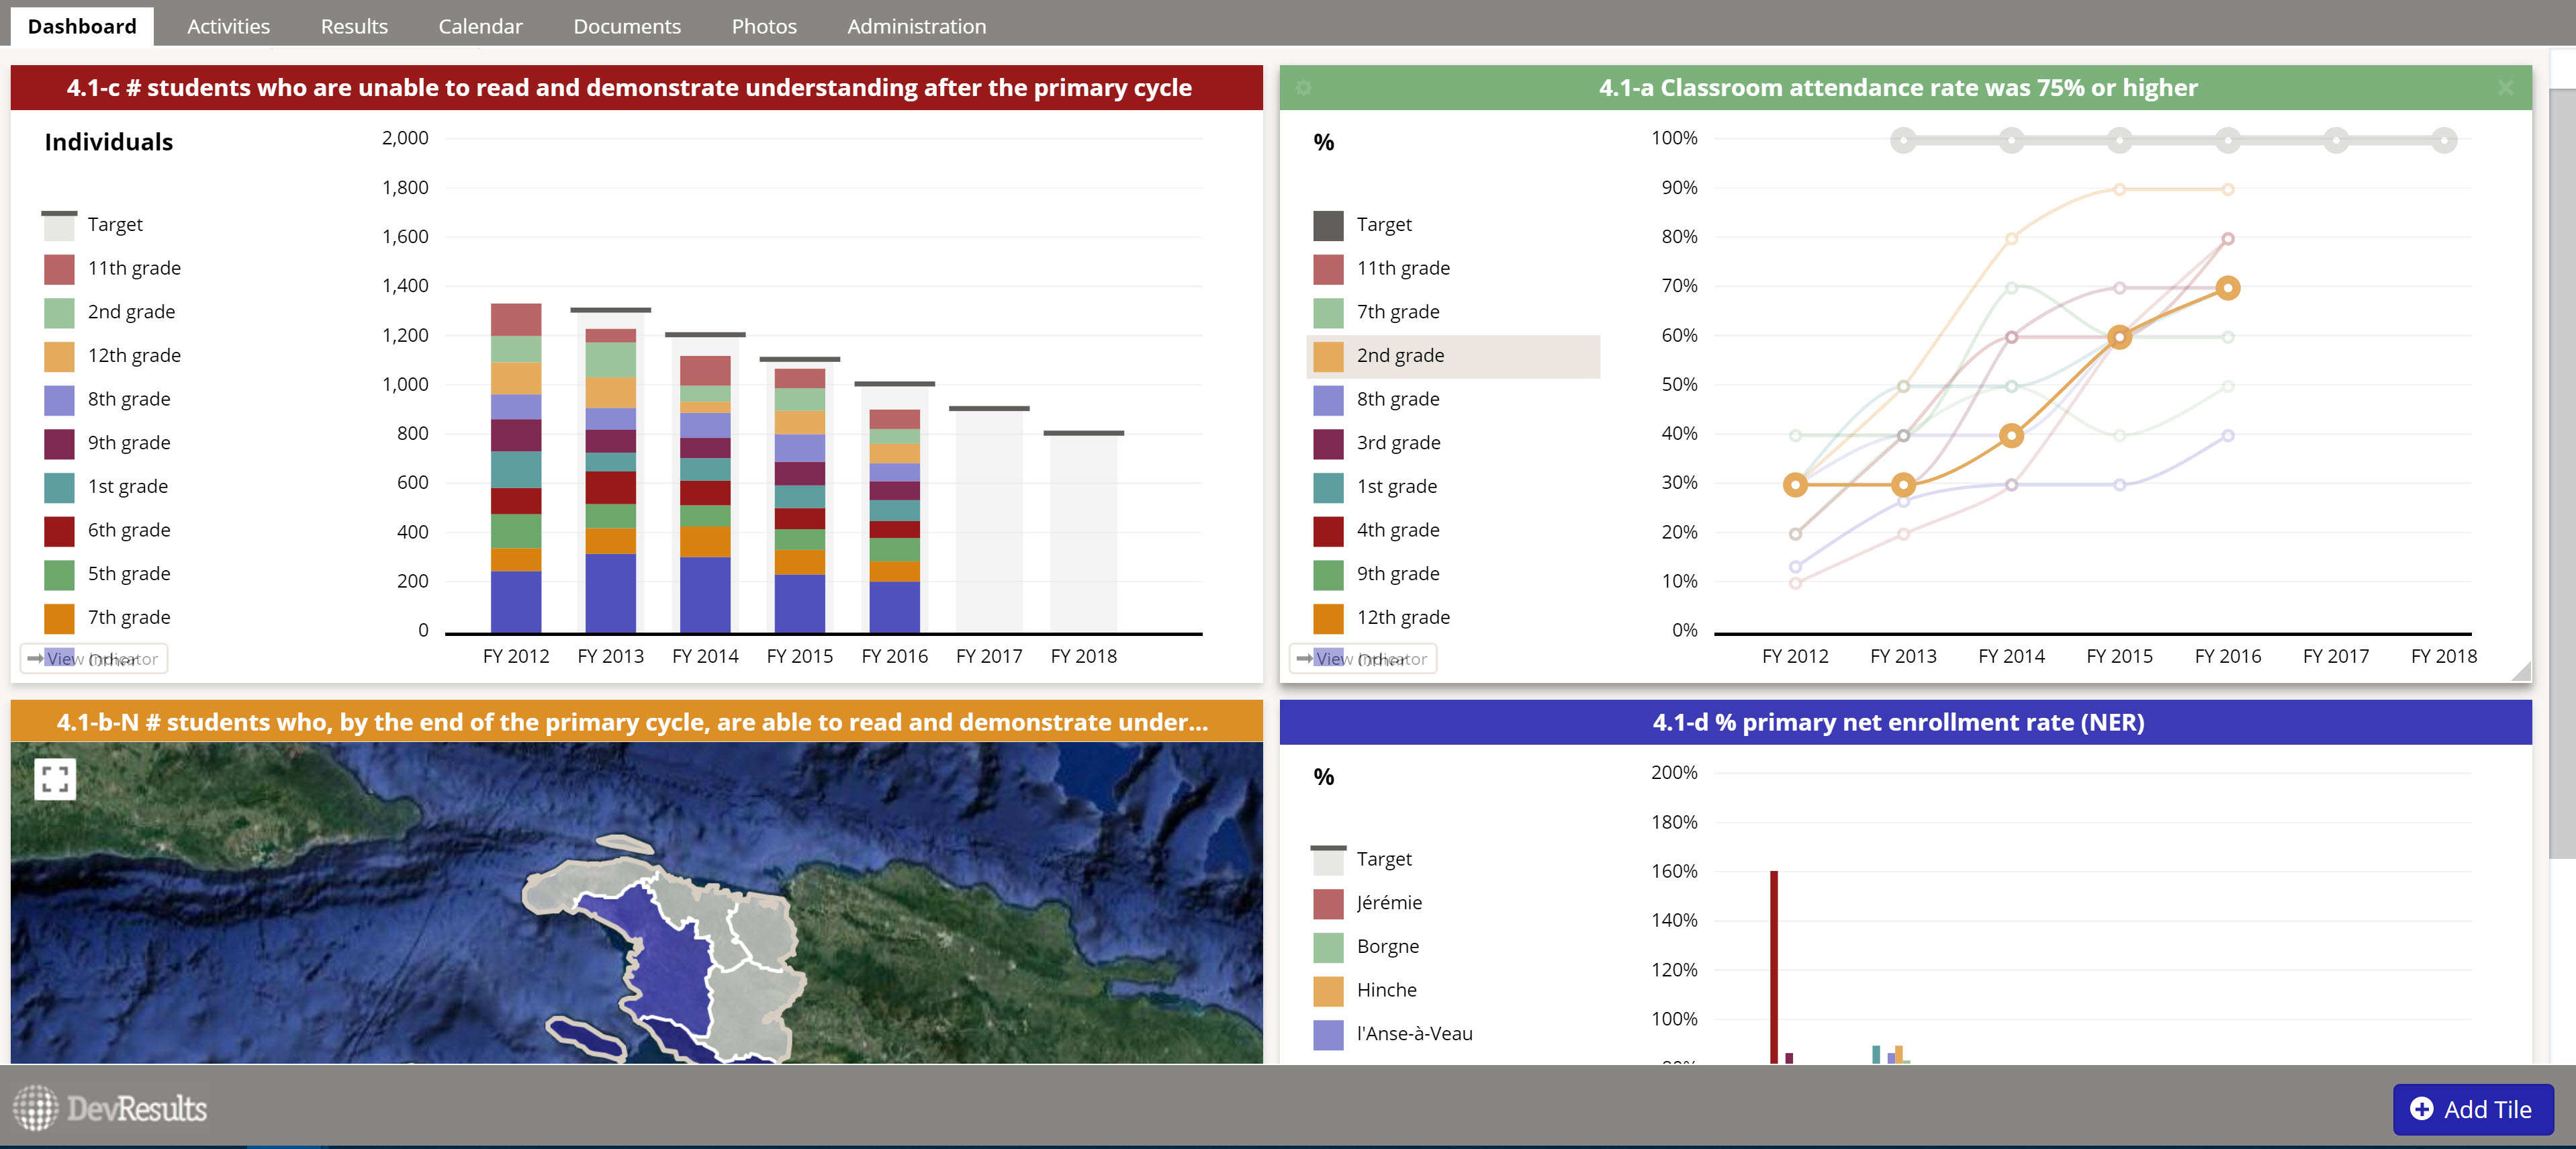
- More Filters - The new indicator tiles have filters by Activity, Geography, and (where appropriate) Reporting Period. This should make it easier for all users to filter their dashboard tiles to the things they most care about, keeping dashboards more relevant and useful. And clicking the View indicator button on any indicator tile will take you to that same visualization in the Indicator's Reports tab with the same filters applied.
- Downloadable visualization - Each dashboard tile's visualization can be downloaded directly from the left-hand configuration panel for that tile.
- More responsive layout - Resizing and rearranging tiles by clicking and dragging is faster and smoother than the old dashboard widgets were.
Available Tiles
We created new tiles for each of the new indicator visualizations and converted most of the Legacy Dashboard widgets to tiles. The new indicator visualization tiles have all the same functionality as on the Indicator Reports tab. See our edit dashboard help page for a complete list of tiles.
We removed two existing widget types during this conversion: the Funding Status widget and the Program Pie Chart widget. Neither of these seemed to be widely used and our beta group did not have specific scenarios where they thought they'd be used. If you'd like these as new dashboard tiles, please talk to us about how you'd like to use them.
Configuration Panel
Every dashboard tile can be configured by clicking the gear icon in the upper left of the tile. This opens a left-hand configuration panel with relevant configuration options, including the tile header, data display options, color, filters, and so on.
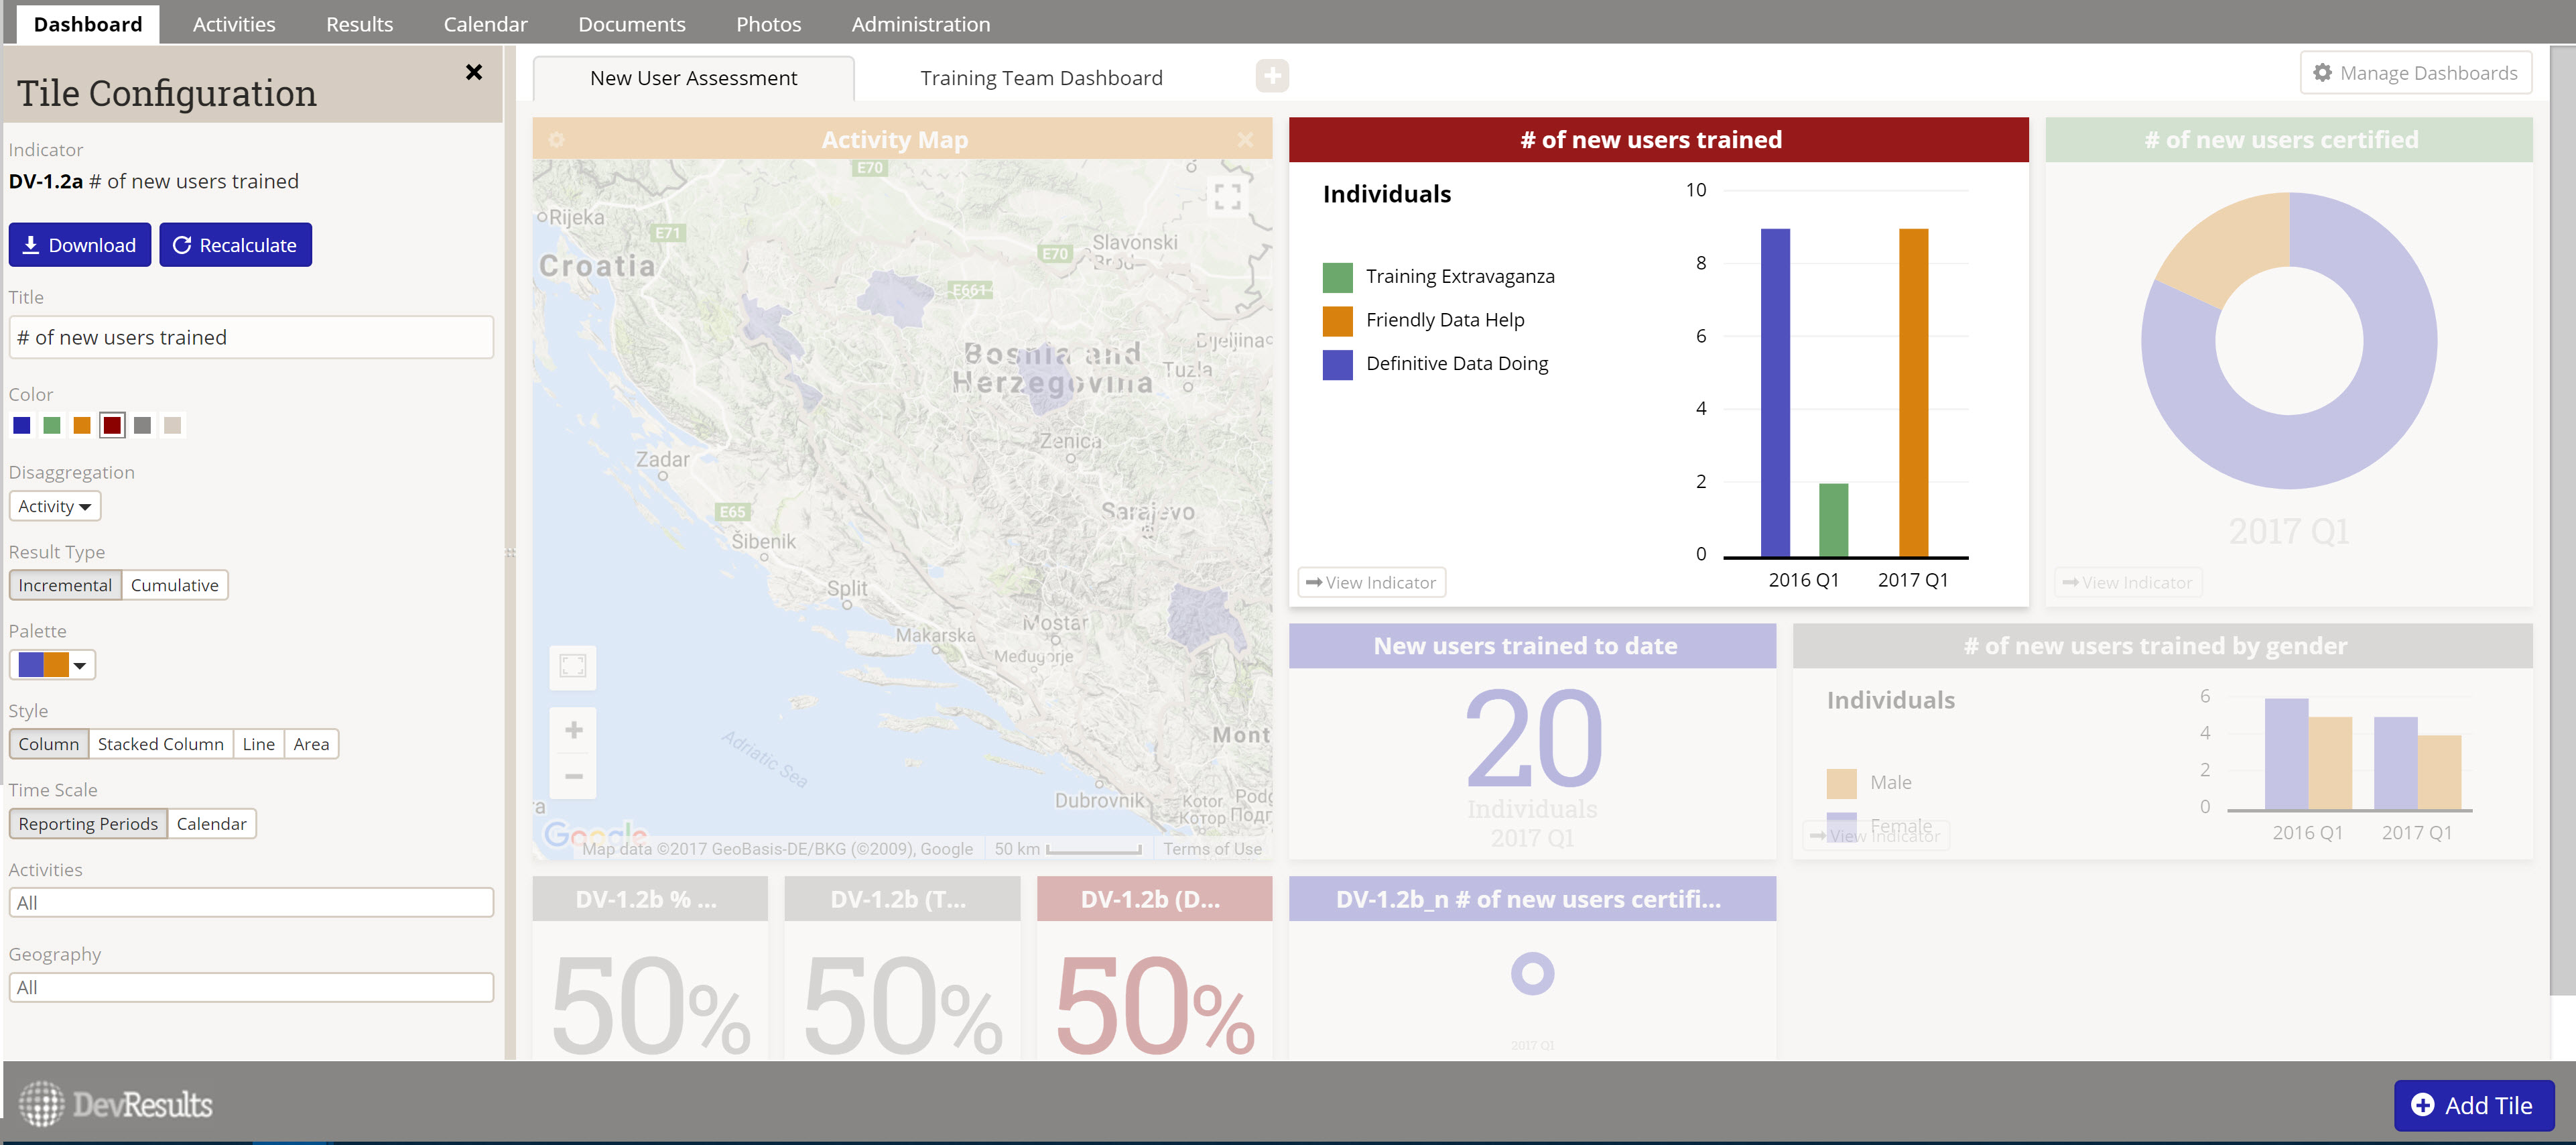
You can read more about these changes and our rationale behind them in our configuration panel release note.
Dashboard Management & Pushing Dashboards
We've added a new role available to Group Permissions: the Dashboard Manager role.
All users can create their own dashboards, make their dashboards shareable, and copy other users' shared dashboards. Dashboard Managers can also push dashboards to individual users. Pushing adds a view-only copy of the dashboard to the user's dashboard view. For more information, see our help page on pushing dashboards to other users.
The Dashboard Manager role was automatically given to all user groups that have the Owner role. Site administrators, please review these settings and grant the role to any other groups you deem appropriate.
Default Dashboards
All DevResults users are provided with a default dashboard the first time they log in: a view-only dashboard so they don't come into a blank screen. We have provided a DevResults System Default dashboard for now, but users who belong to a group with View & Edit permissions on Program Settings can edit the default dashboard for your DevResults site. If you'd like to do so, please see our help page on default dashboards.
How Do I Access It?
As of today, your landing page has been updated to the new Dashboard. Using the main menu navigation for Dashboard will also take you there.
If you've already been using our New Dashboards in beta, any dashboards you've created will be visible here. If you haven't yet used the New Dashboards, you'll see a System Default.
Note: We were unable to copy existing legacy dashboards into the new dashboard layout because the tiles and structure are so different, so you'll need set up your own new dashboard.
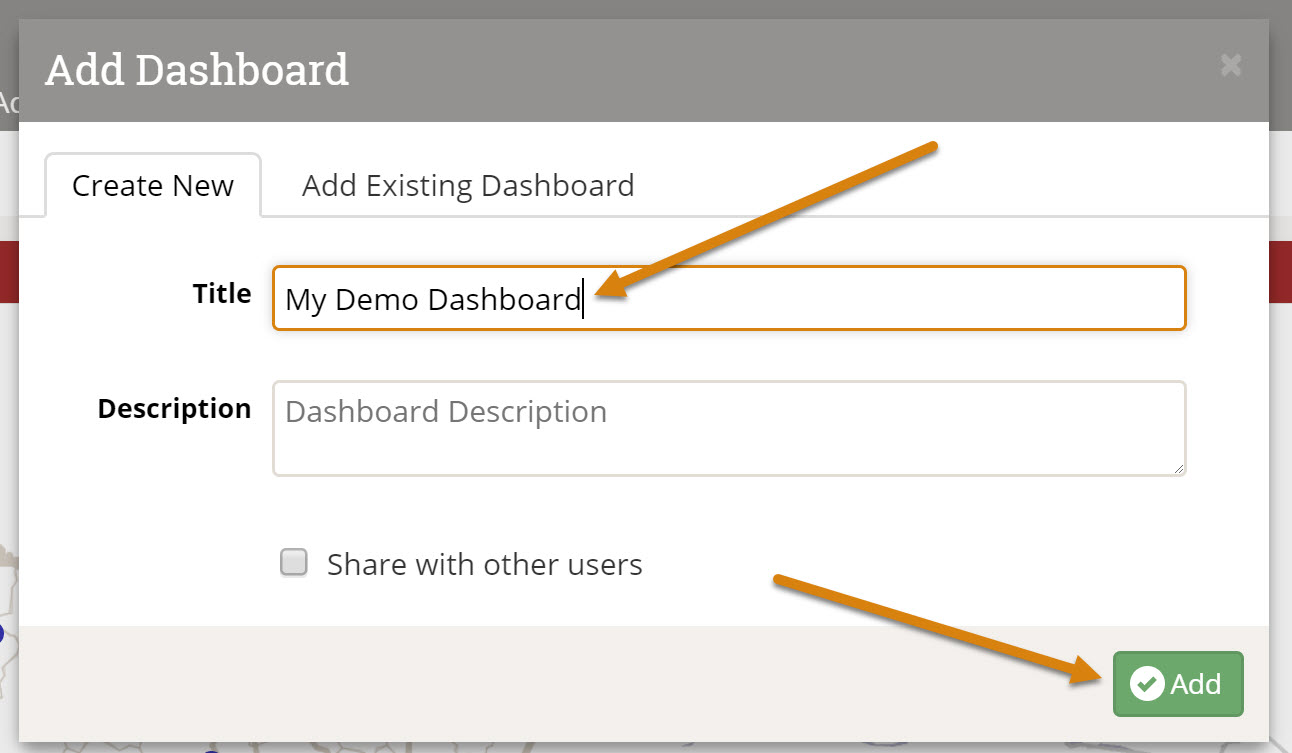
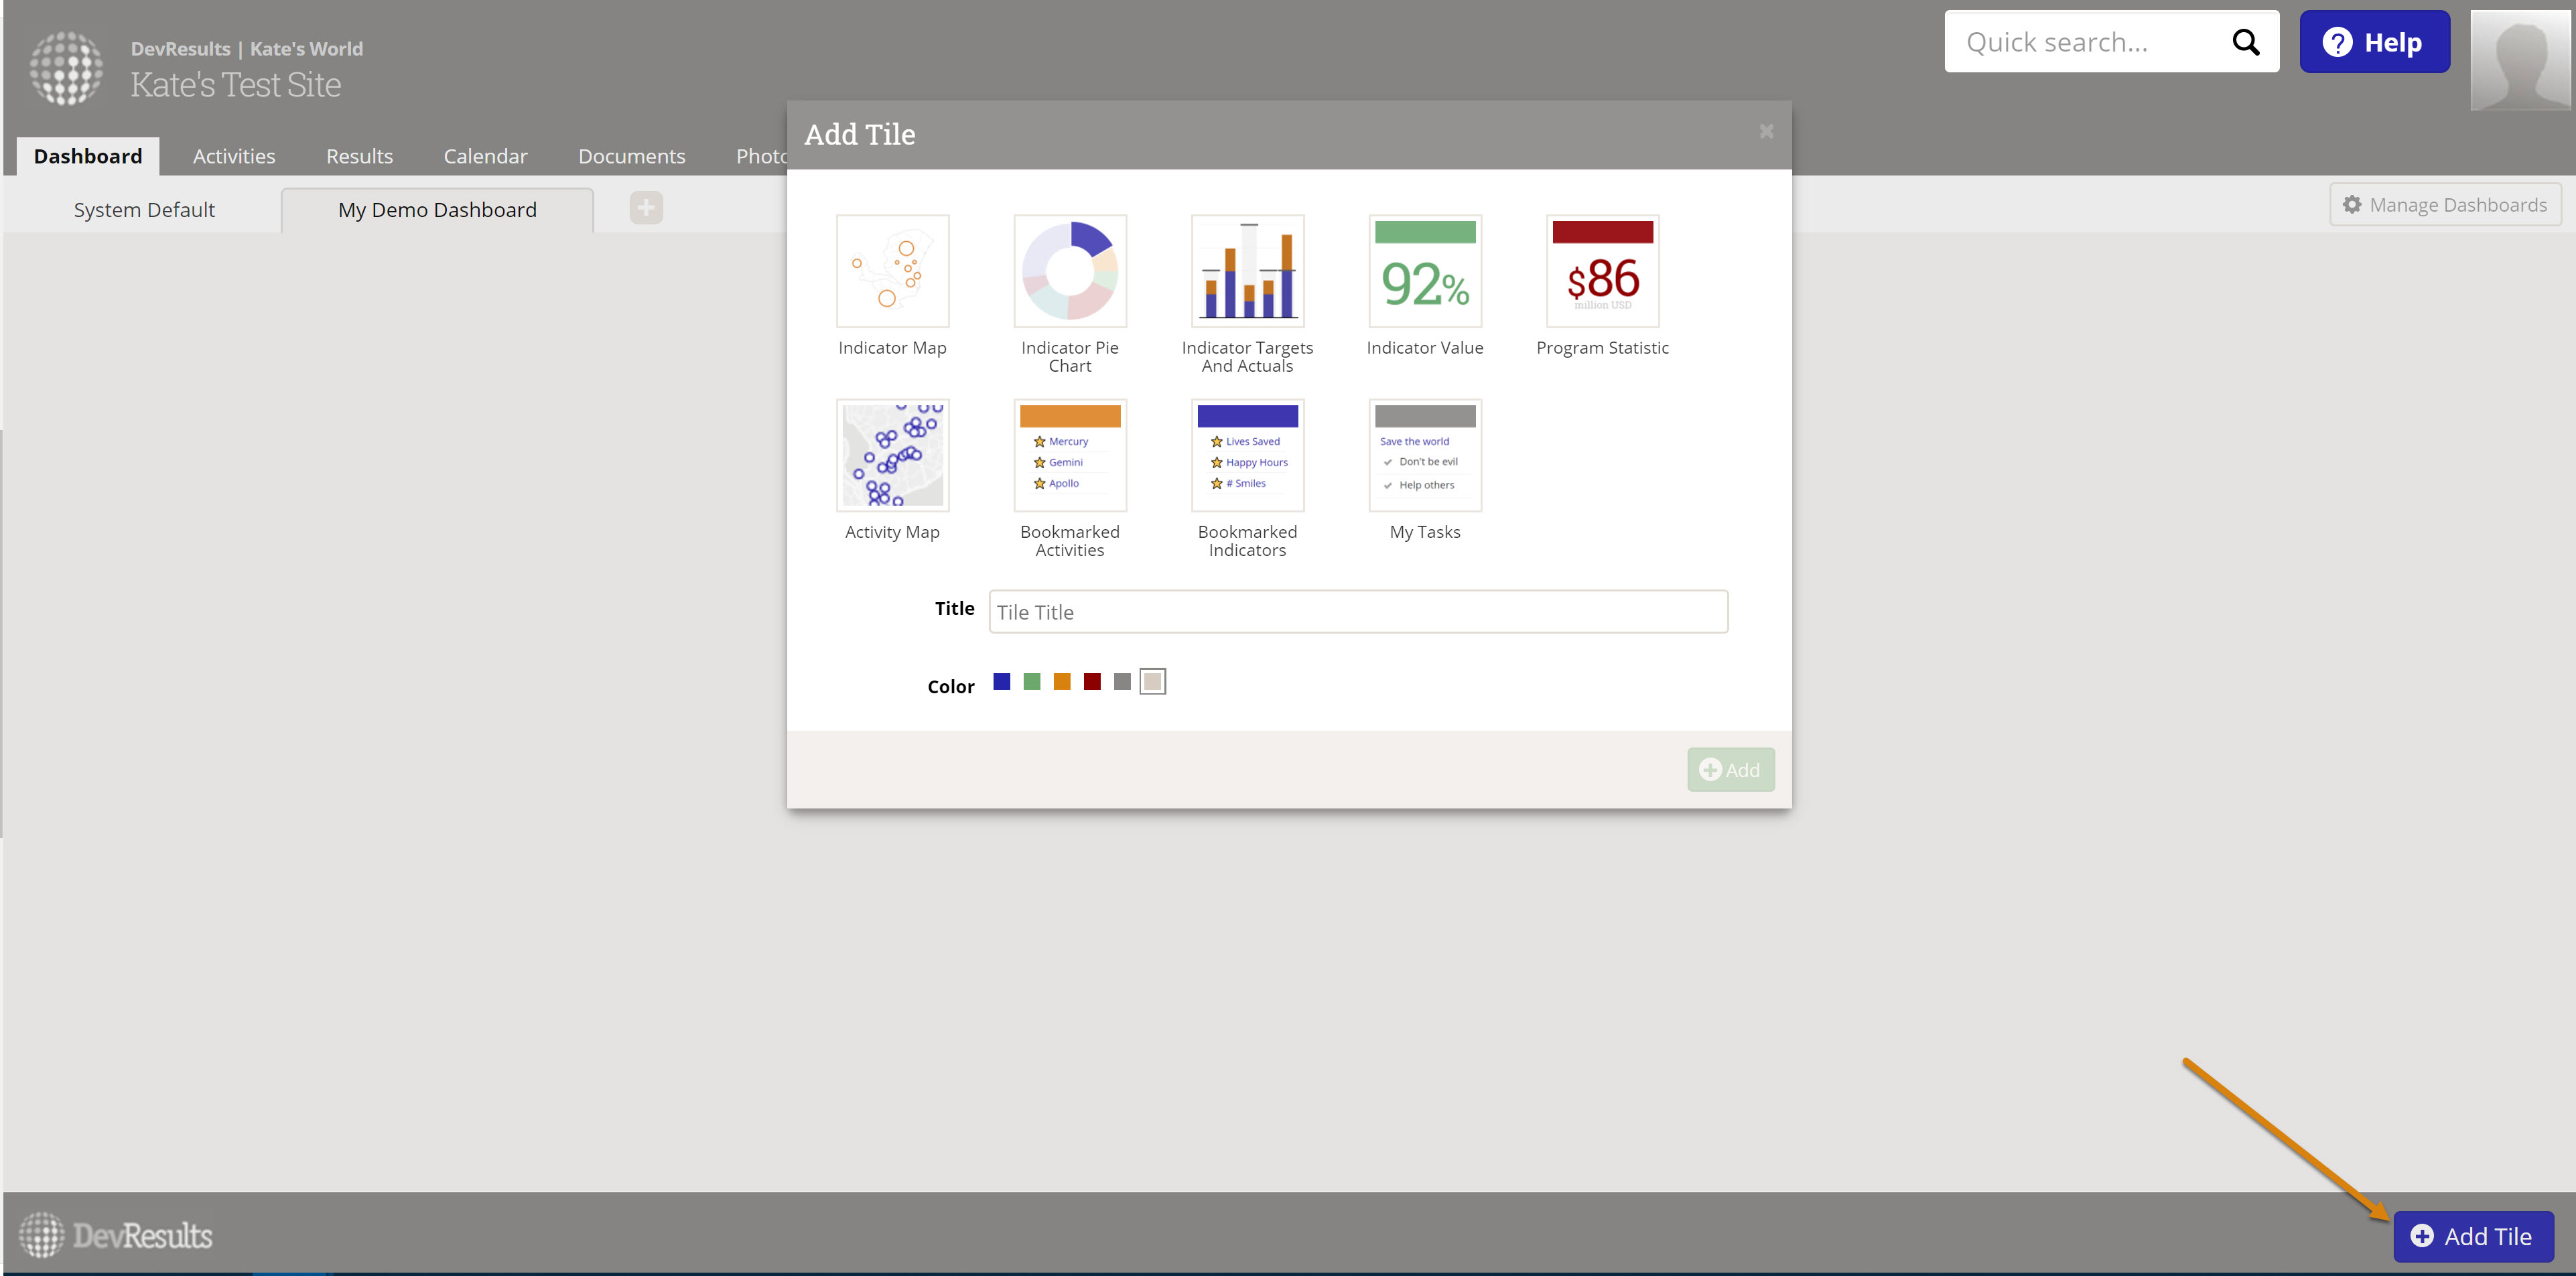
To get started with a new dashboard, click the + next to the System Default tab.
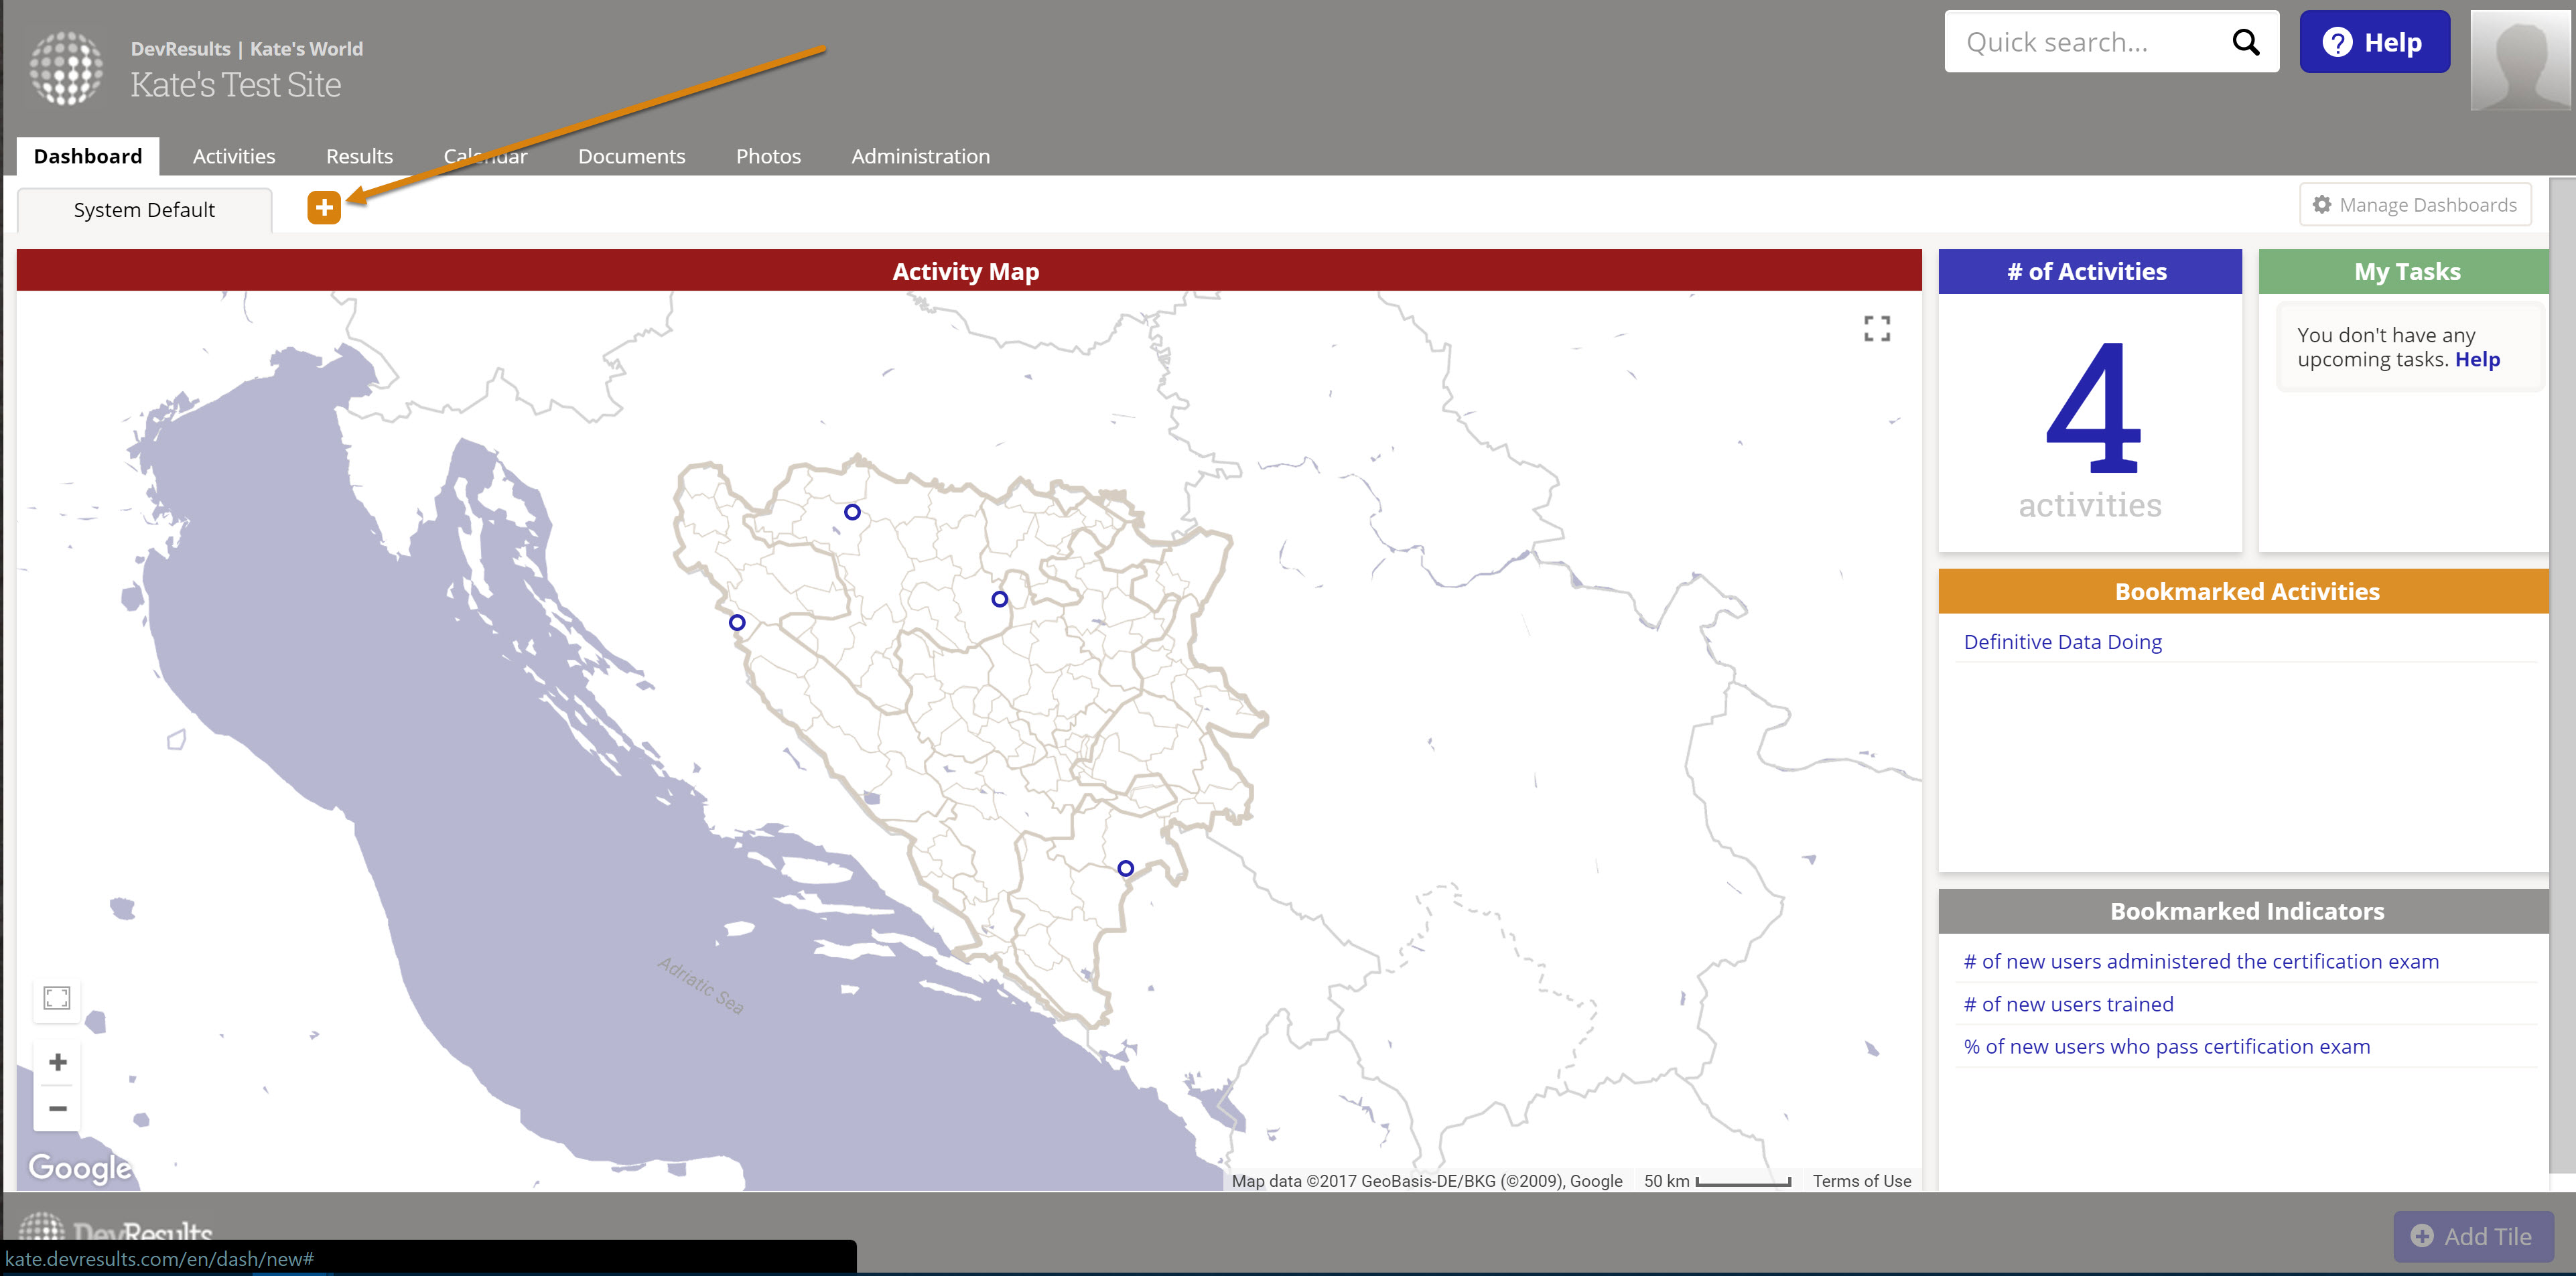 Give your dashboard a name and click Add to create it.
 Then use the Add Tile button in the lower right to add the tiles you care about.
For more detailed step-by-step instructions, see our edit dashboard help page.
Existing Dashboard Phaseout
If you want or need to access your old dashboard, in the Dashboard menu go to Legacy Dashboard.
 We will be removing the legacy dashboards at the end of 2017, so please set up a good default dashboard for your site, push dashboards to your users, and encourage all your users to set up their own new dashboards before then.
Here's what you can expect from us along the way:
- October 2017: We will post a system announcement explaining that legacy dashboards will be phased out, with information on how to set up new dashboards.
- November/December 2017: We'll send emails to site owners communicating the exact phase-out dates, an email template for you to distribute to your users, and template text for site announcements. You can choose the options that make the most sense for your users (email, site announcement, etc.)
- December 2017: We'll provide a site announcement when we officially phase-out the old dashboard, so all users are aware of the change.
Thank You
Last but certainly not least: thank you to all of our beta testers for providing us so much feedback over the last four months. This was our first time running a beta test in parallel on the live site, and we have been so pleased and amazed with the amount of participation and feedback we received. We appreciate your time and attention in testing the new tiles and structure, asking questions, and sending us suggestions or input. This final product is much stronger thanks to your efforts, and we already have a list of future possible improvements, as well!
If you missed out on the opportunity, be sure to enroll in our beta tester program. If you have feedback specific to the new dashboards, feel free to email me!