Most of you are familiar with Pito, our query tool for viewing indicator performance data. I'd like to introduce you to Pito's new little brother: Single Indicator Pito. For an individual indicator, the Reports tab has always contained three things: a choropleth map, an actuals vs. targets chart, and a results grid. As many of you have noted, the results grid was pretty limited in how you could arrange and display data. So we have replaced it with a Single Indicator version of Pito. It has many of the same filters and row/column configurations you're used to in full Pito, but it's designed to only show you the indicator you're currently viewing with a few added bonuses. Here's what you need to know to start using it:
1 Who Can See It?
If you can view an Indicator's Reports tab, you can see and use Single Indicator Pito!
2 How Do I Find It?
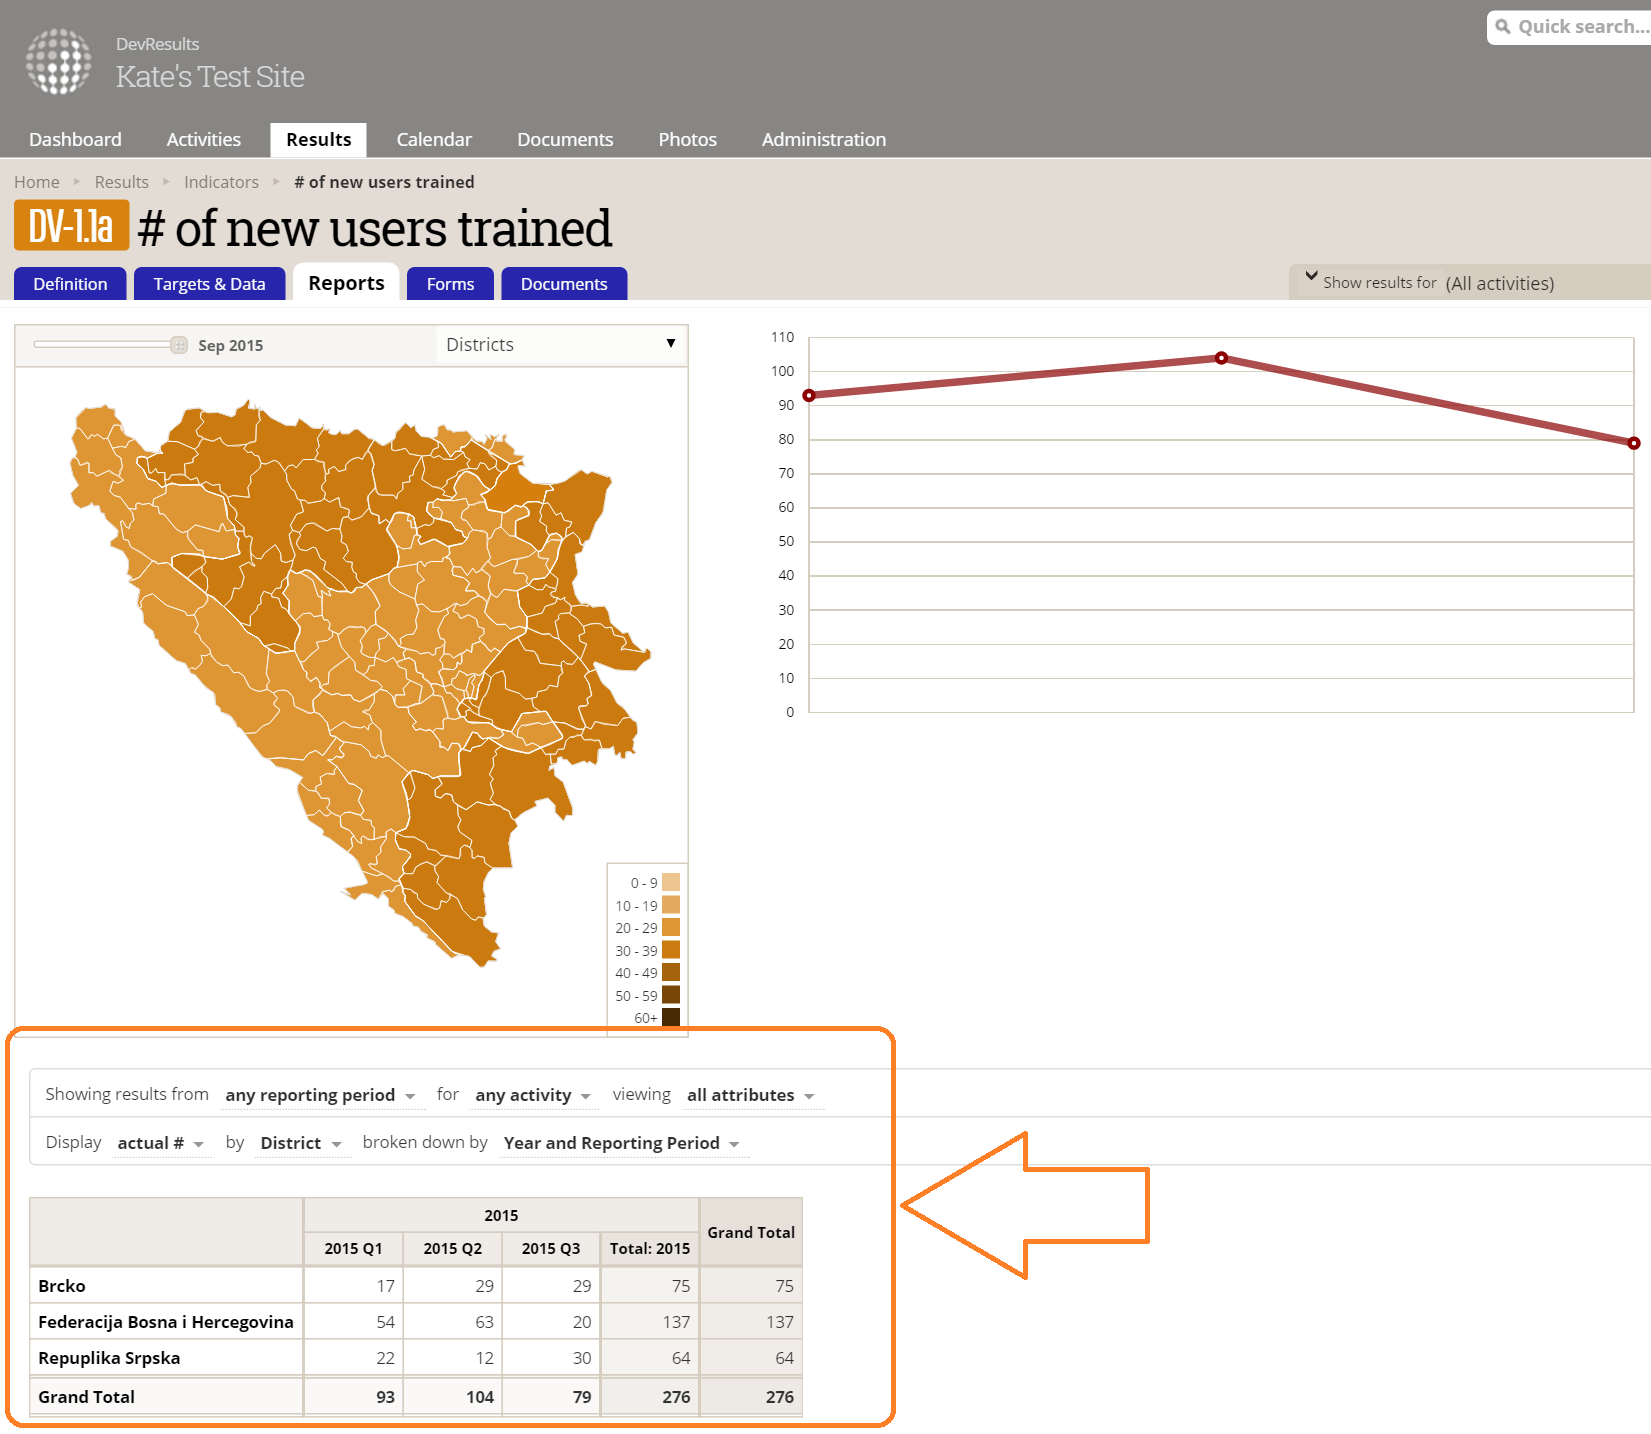
From the main navigation menu, go to Results->Indicators. When the Indicators index page opens, click on the indicator of your choice. This will open to your Indicator Definition tab. Click the Reports tab. Single Indicator Pito is at the bottom of this page, just underneath the choropleth map:
3 How Do I Use It?
If you've ever used full-sized Pito, this will look familiar:
 The top row -- Showing results from -- allows you to filter what you see below:
- to specific reporting periods
- to specific activities
- to specific disaggregations (attributes).
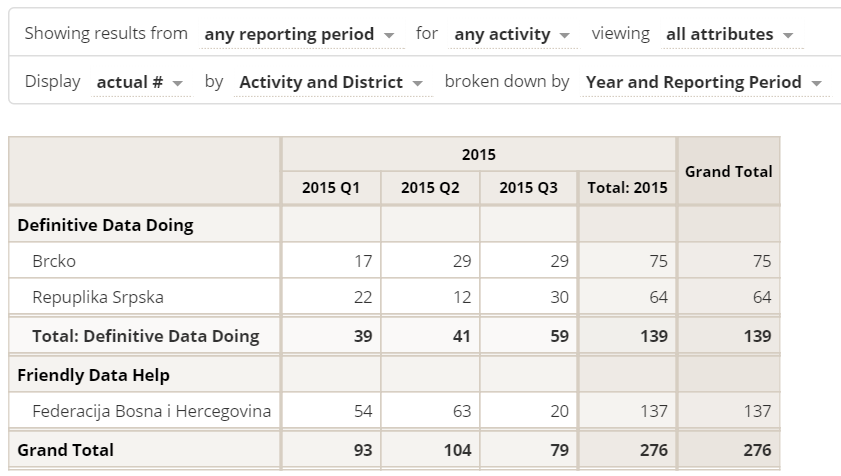
The second row -- Display by -- allows you to define the rows and columns you want to see below:
- the actuals dropdown lets you choose to display actuals, activity targets, program targets, or any combination of those.
- by defines the rows
- broken down by defines the columns
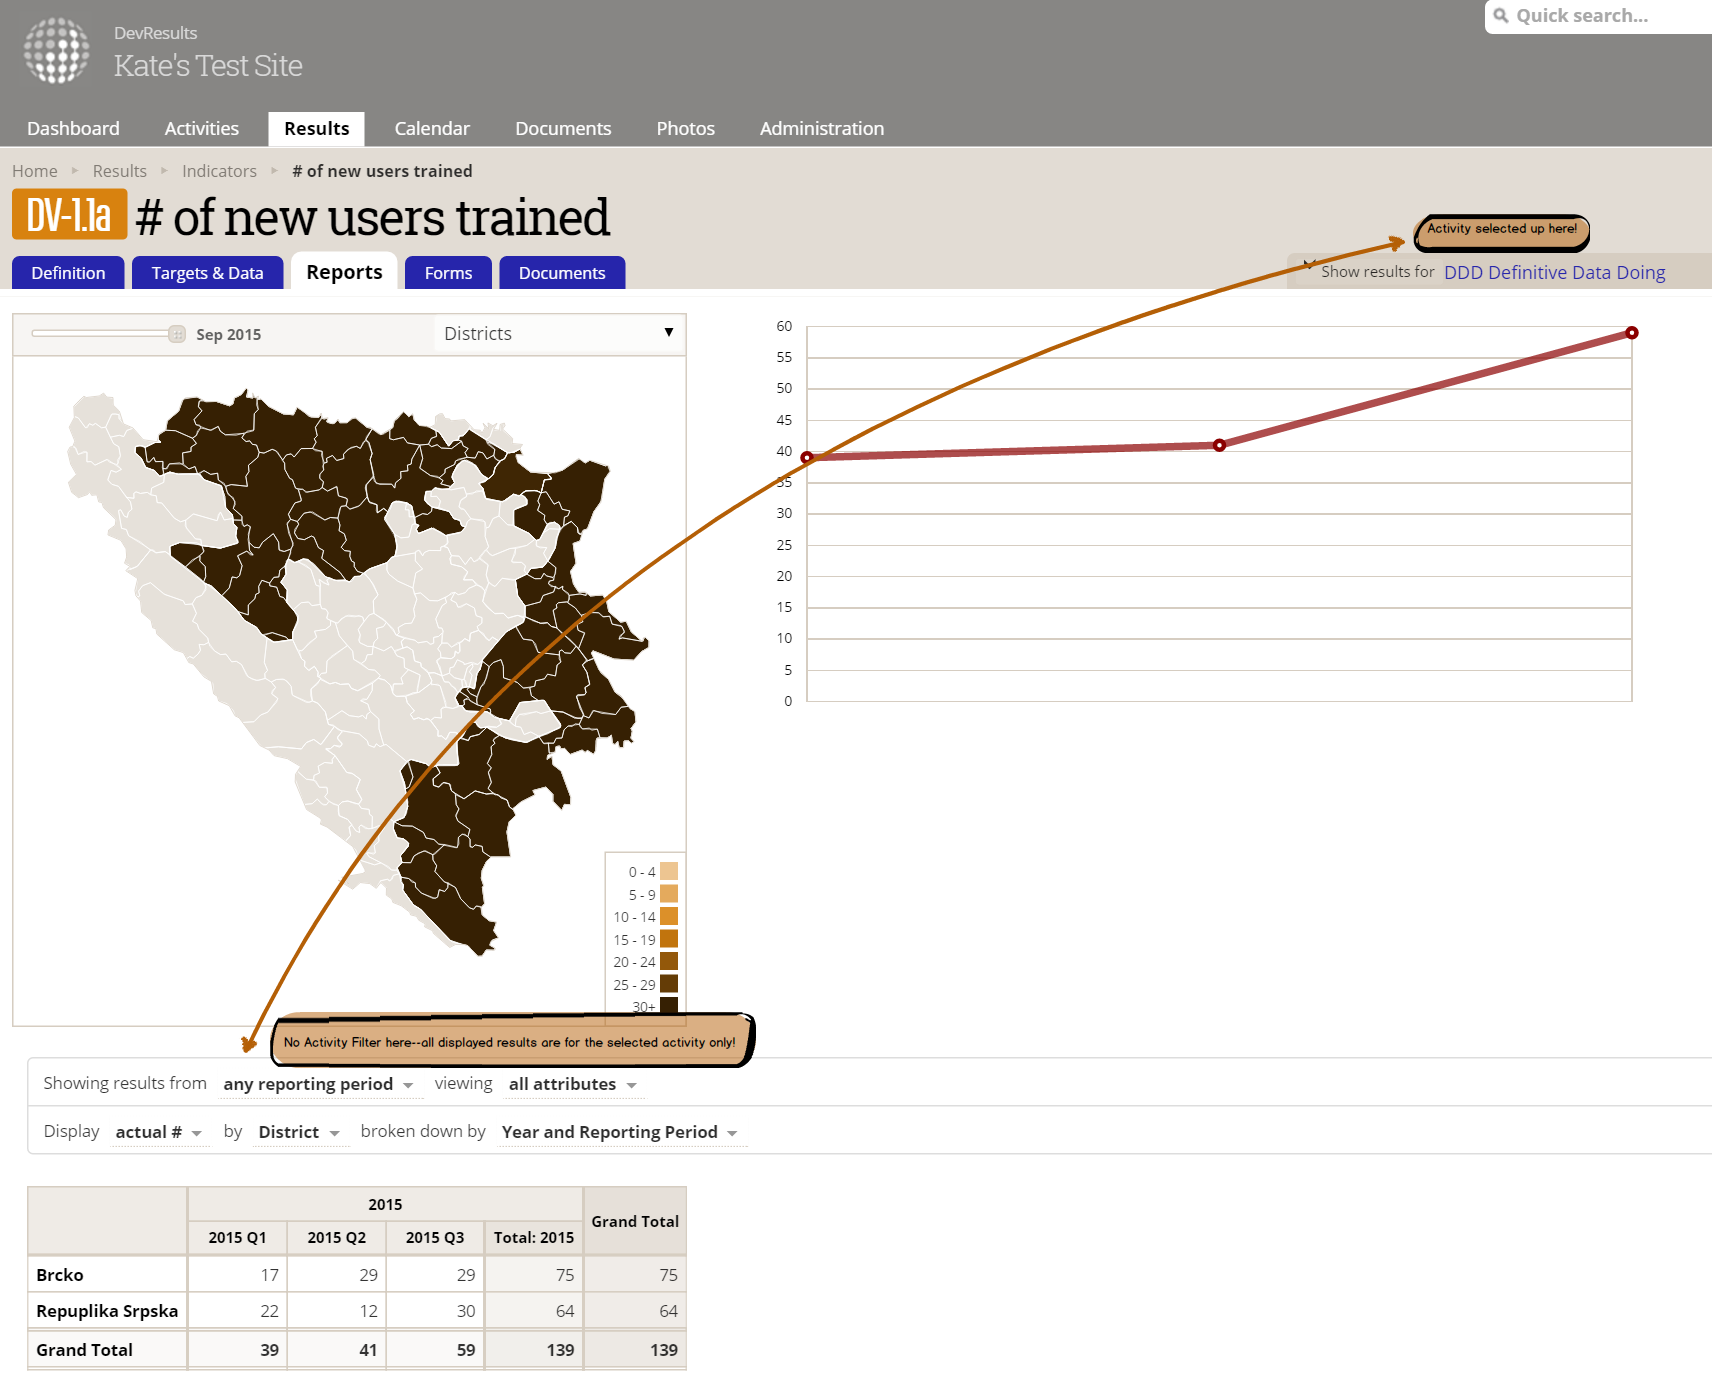
4 How Is It Different From Pito?
By default you'll see things for all reporting periods, activities, and attributes. If you've already selected an Activity from the dropdown in the upper right of the entire page, the Activity filter will disappear and single indicator Pito will show you only data for that Activity:
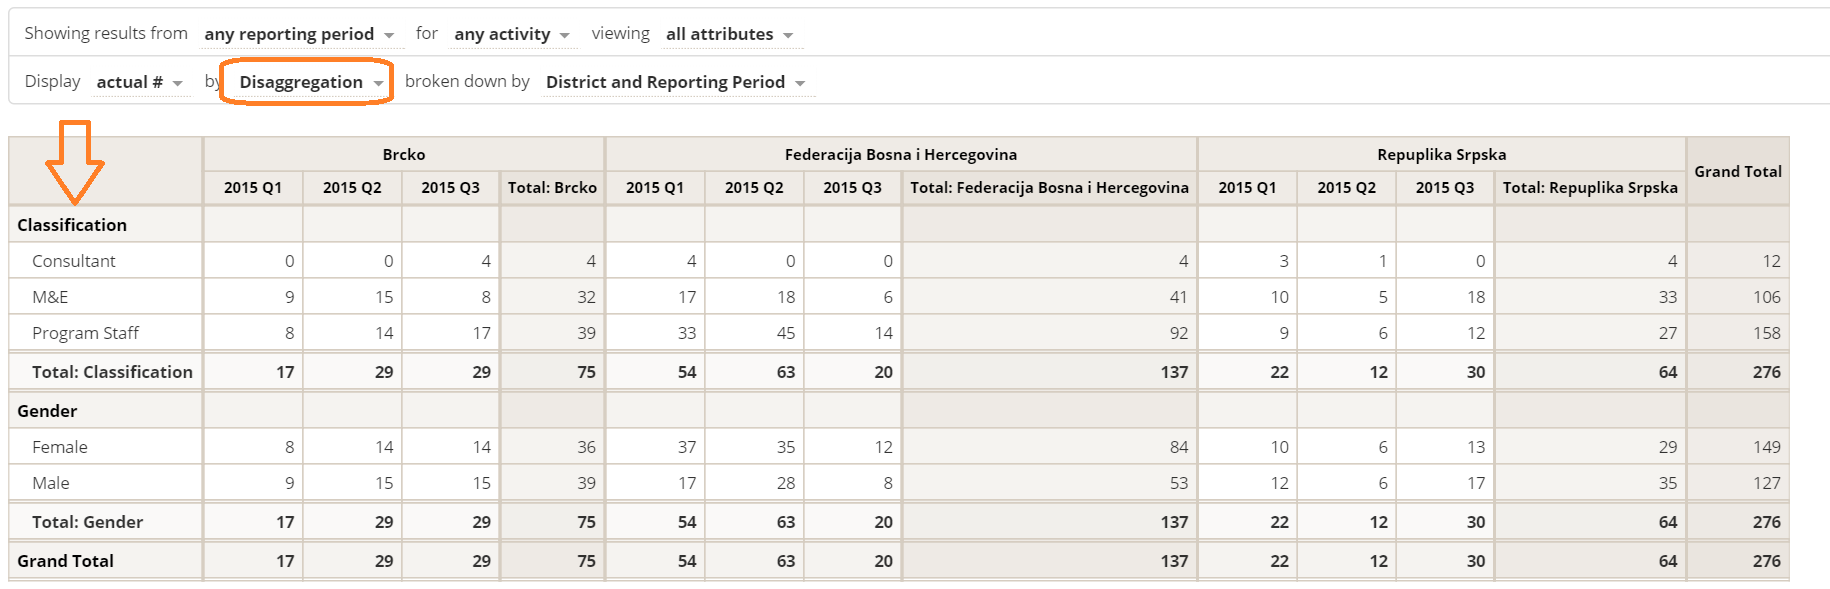
 As with regular Pito, you can have one subdivision within each row/column selection.
New with Single Indicator Pito: you can explicitly set disaggregations as rows!
Other Related Updates
In addition to replacing the Reports tab grid with single indicator Pito, we've also streamlined computation and display in the Results grid on the Indicator Targets tab. The grid won't look noticeably different, but it is handling computations more effectively and efficiently, particularly for average indicators.