We are pleased to announce our latest major visualization overhaul: the new Indicator Choropleth Map.
What It Gives You
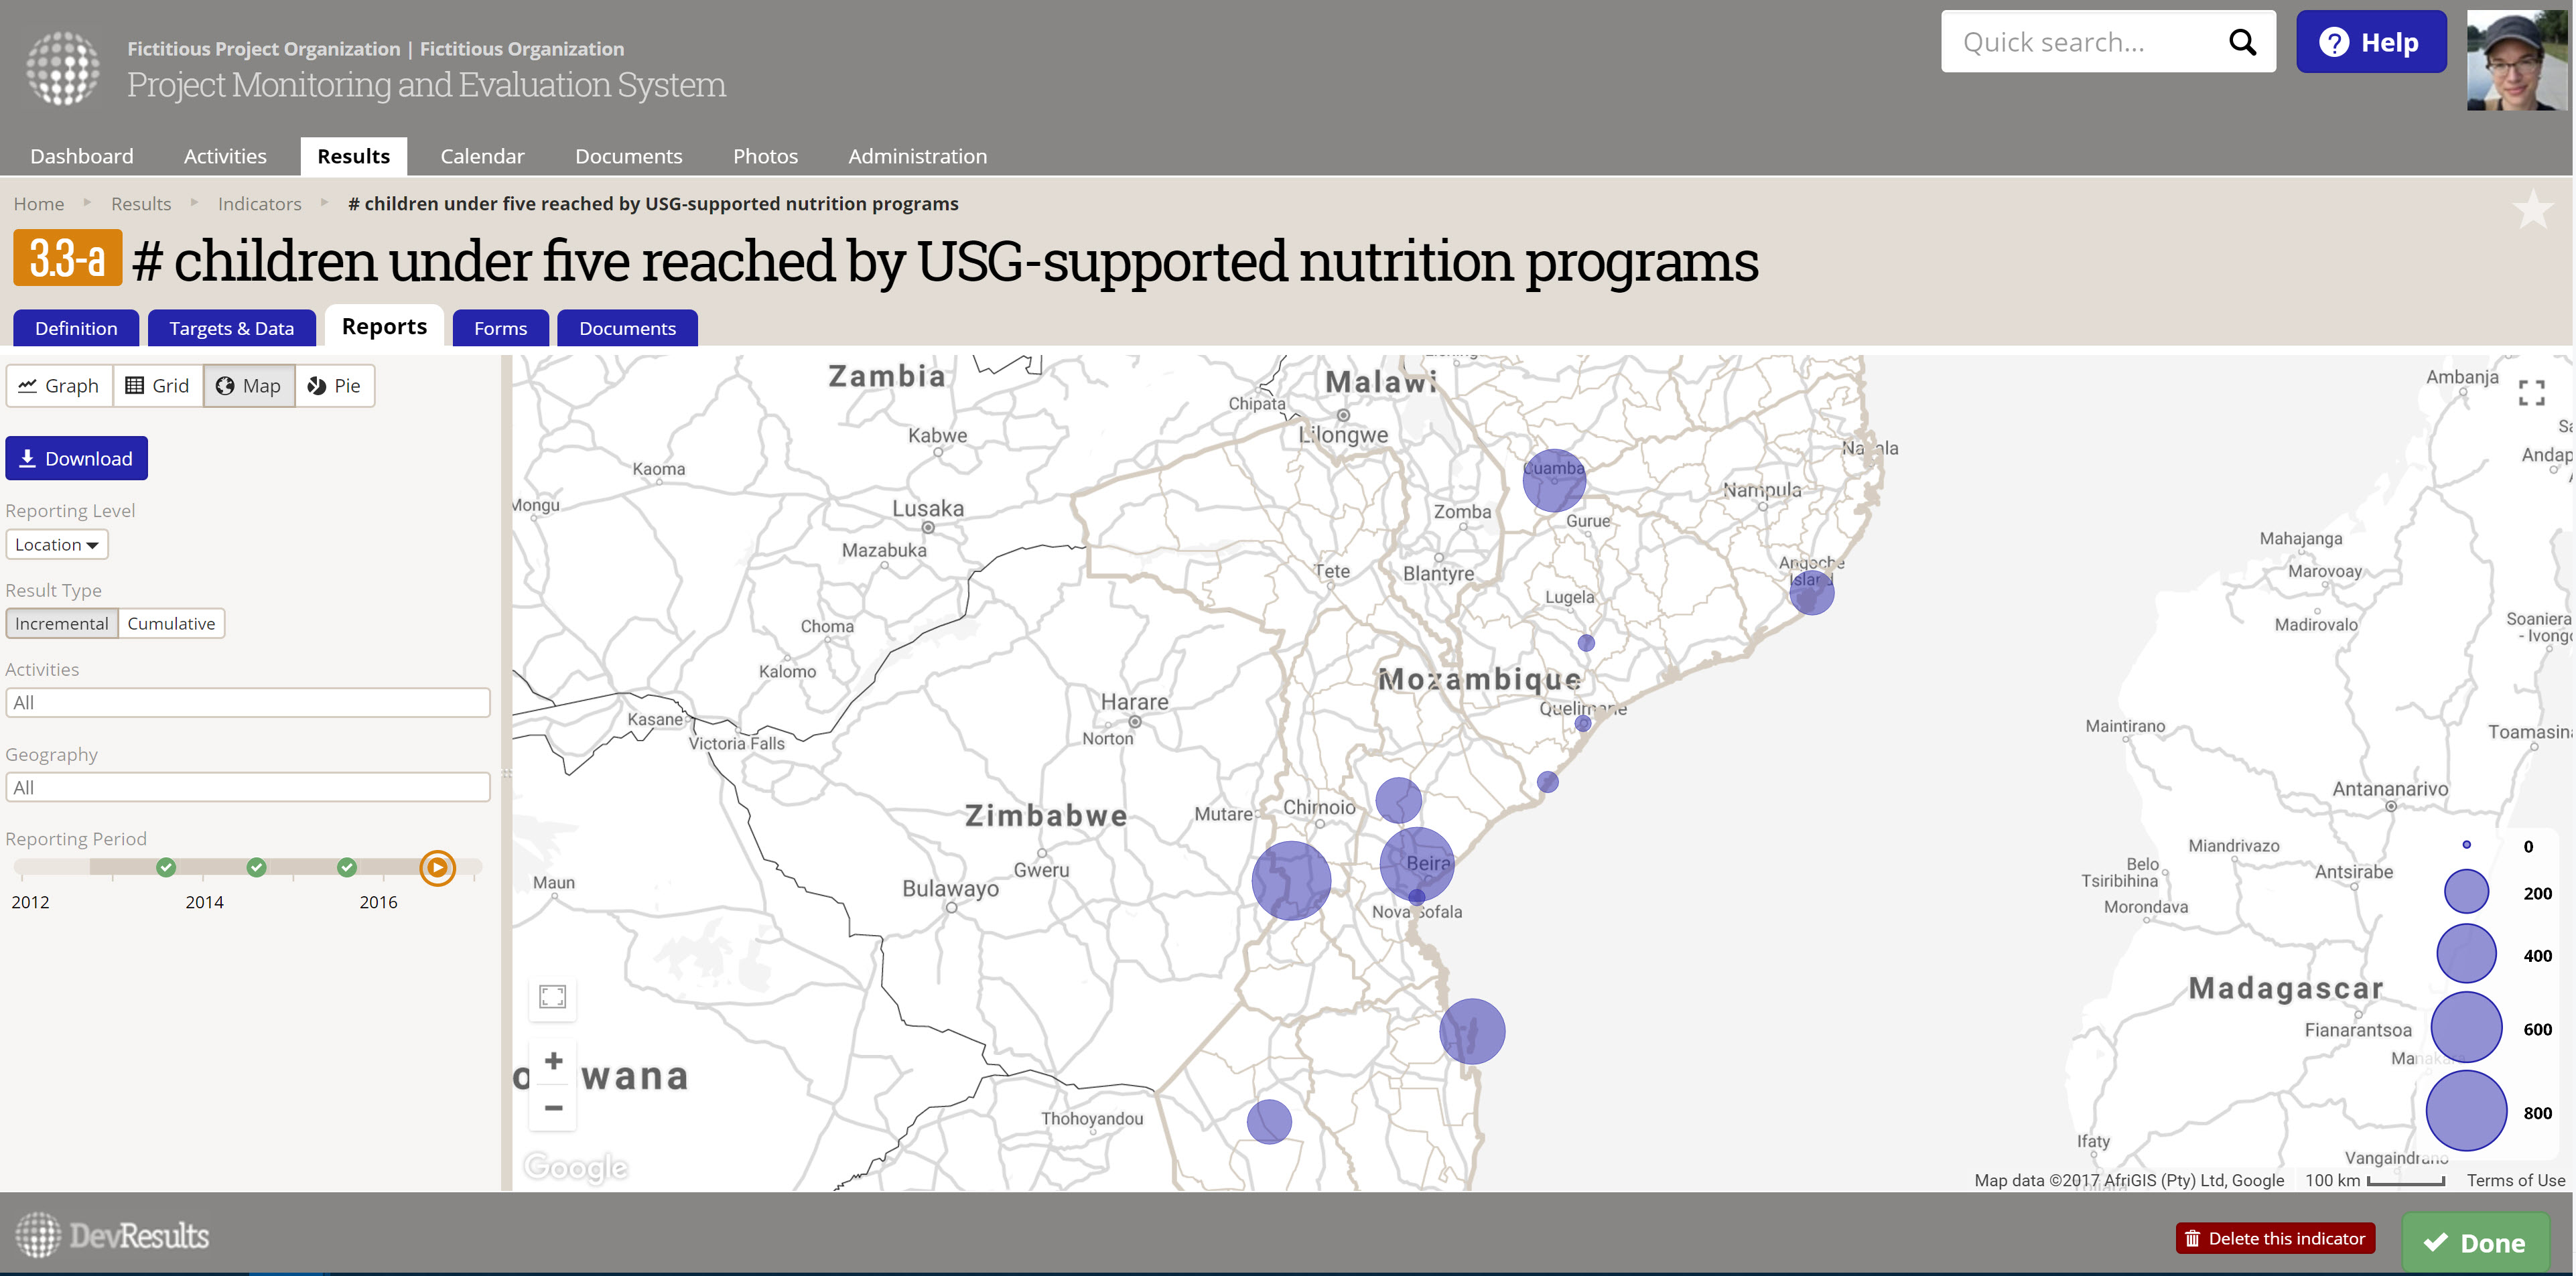
The new version of the Indicator Choropleth Map (visible on the Indicator Reports tab under Map) will generate a choropleth map based on your indicator's data, just as it always has, and you can configure which reporting period and geographic disaggregation you want the map to display.
But we've added several key pieces of functionality:
- We stopped limiting the size of the map, so it will now expand to fill the available screen space you have.
- Since we had more room, we're now using Google Maps as the map base layer, which allows you to zoom and pan the map to your heart's content with snappy response times.
- For selecting the reporting period displayed, we removed the old slider and added a Reporting Period Timeline in the left-hand configuration panel. Just click on the reporting period you're interested in.
- We've exposed an Incremental vs. Cumulative control in the left-hand configuration panel, giving you the option to display the selected reporting period's data on its own (incremental) or all data to date for that reporting period (cumulative).
- As with the updates to Pie Chart and Targets vs. Actuals, we've included Activity filtering in the left-hand configuration panel.
- Many of you have requested that we make this map downloadable. We can't provide the full Google Maps functionality in a download, but we have added a more generic map structure download. We'd appreciate your input on this functionality to find out what you most want and need from the download.
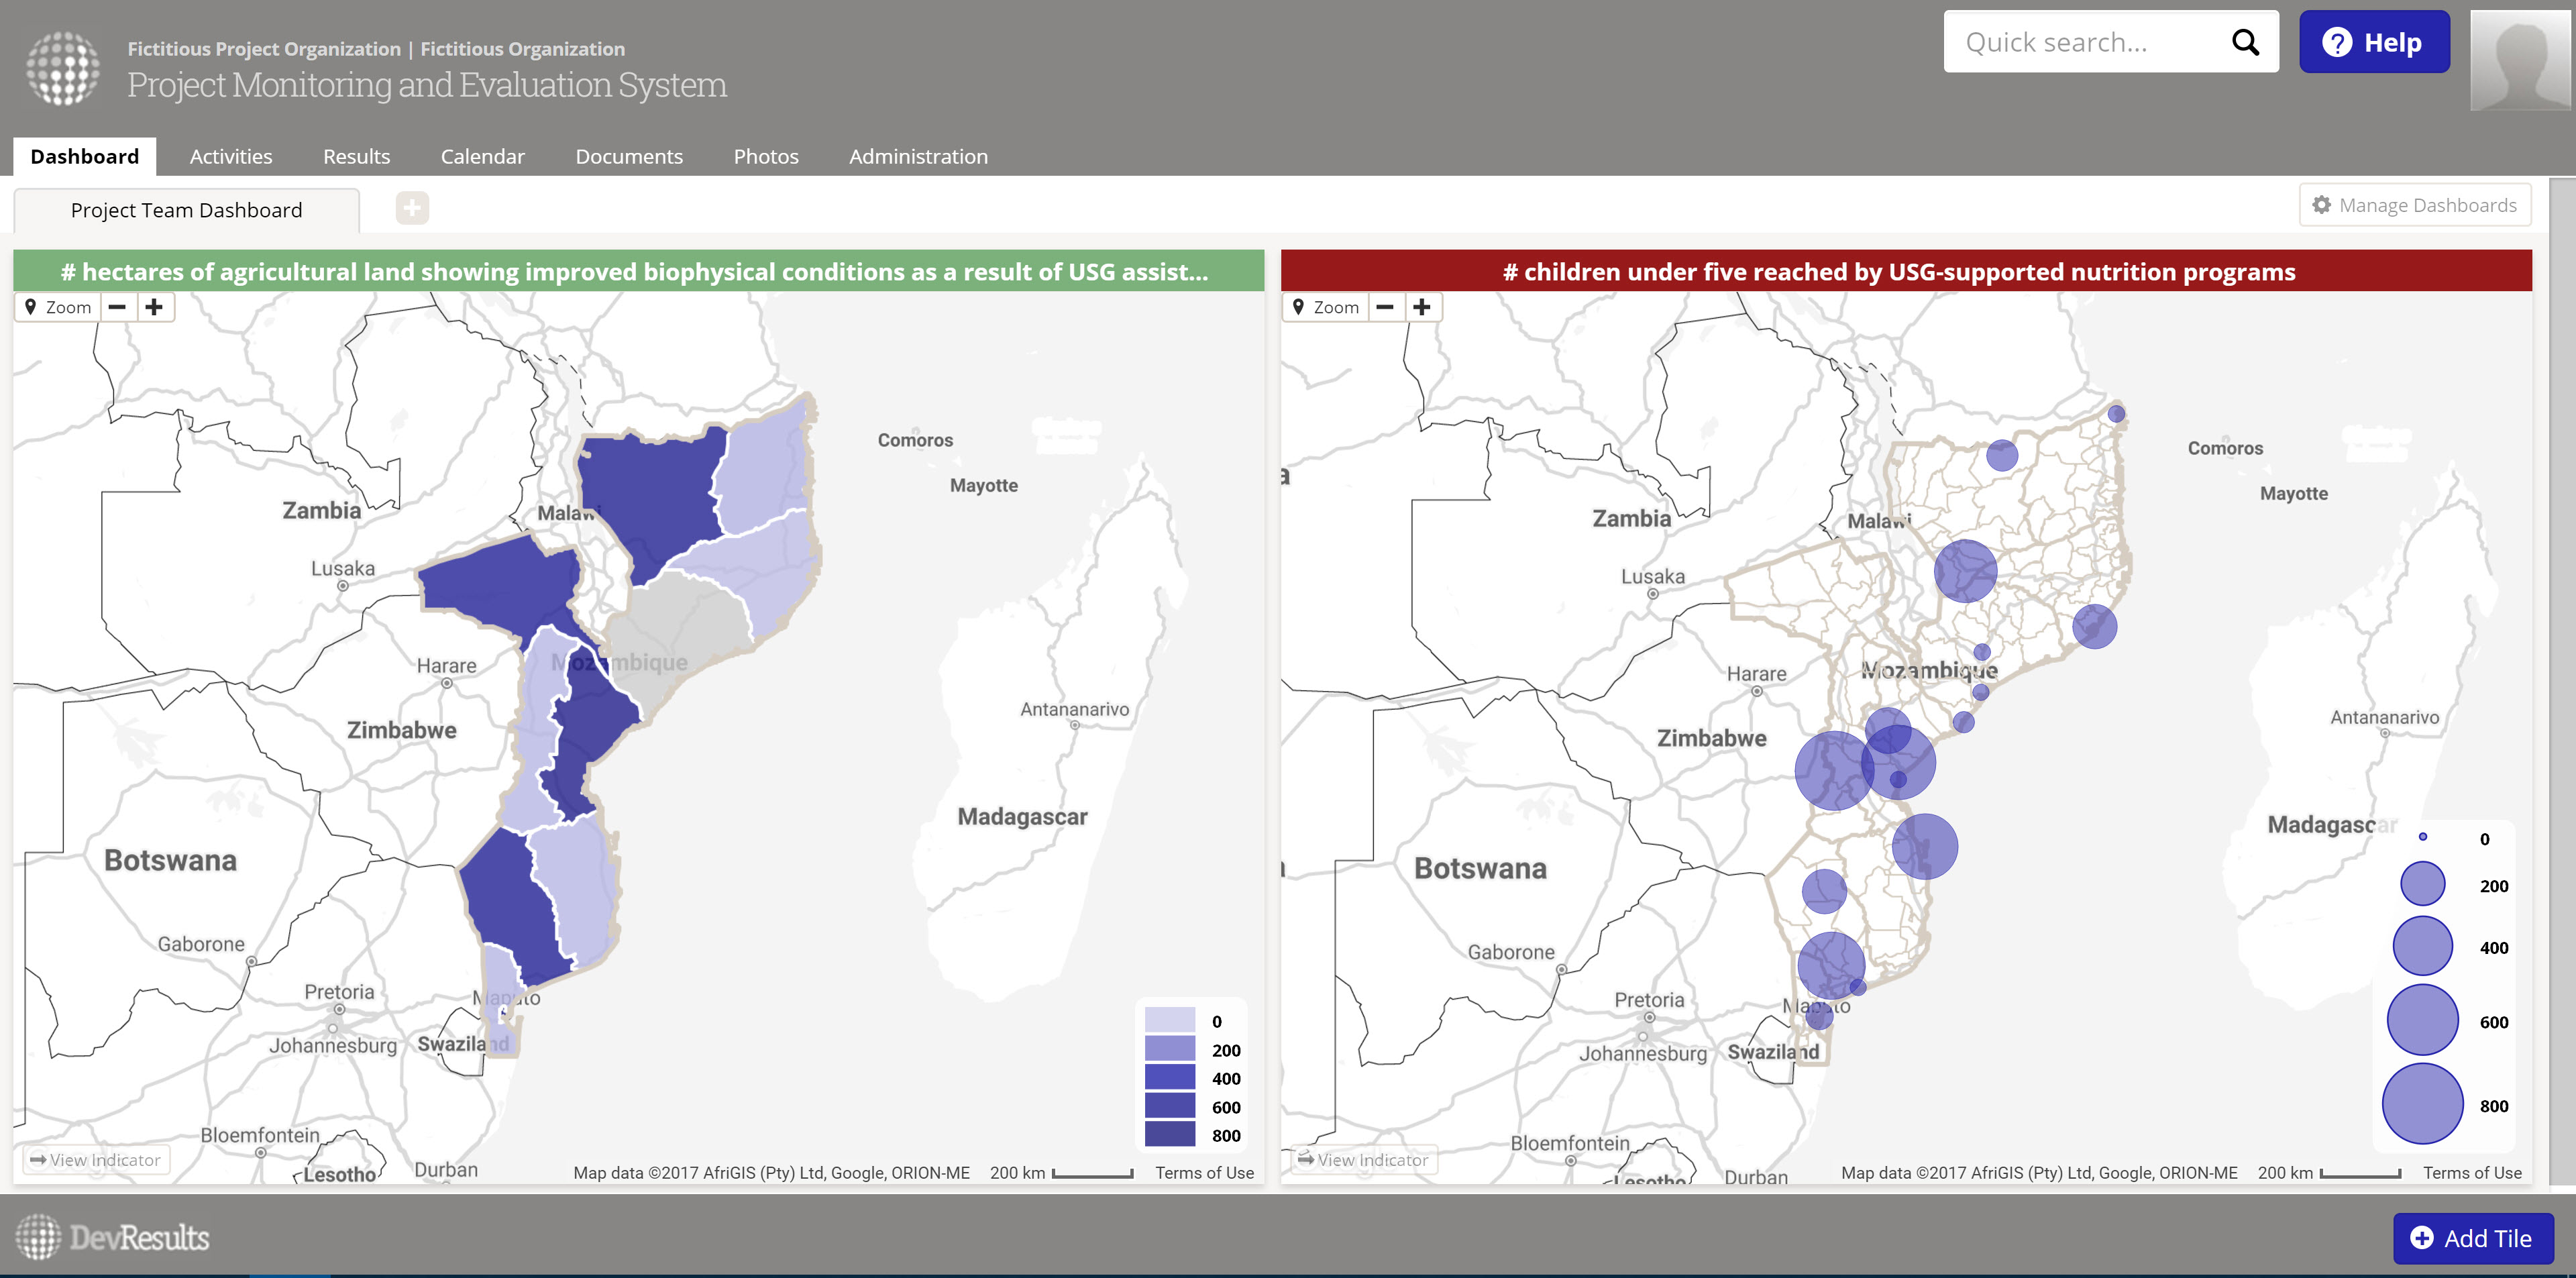
- And yes, you guessed it, we've made this visualization available in the New Dashboard (Beta) as a tile, too!
How Do I Use It?
Open any indicator in your DevResults site and click the Reports tab. Click the Map button in the upper left.
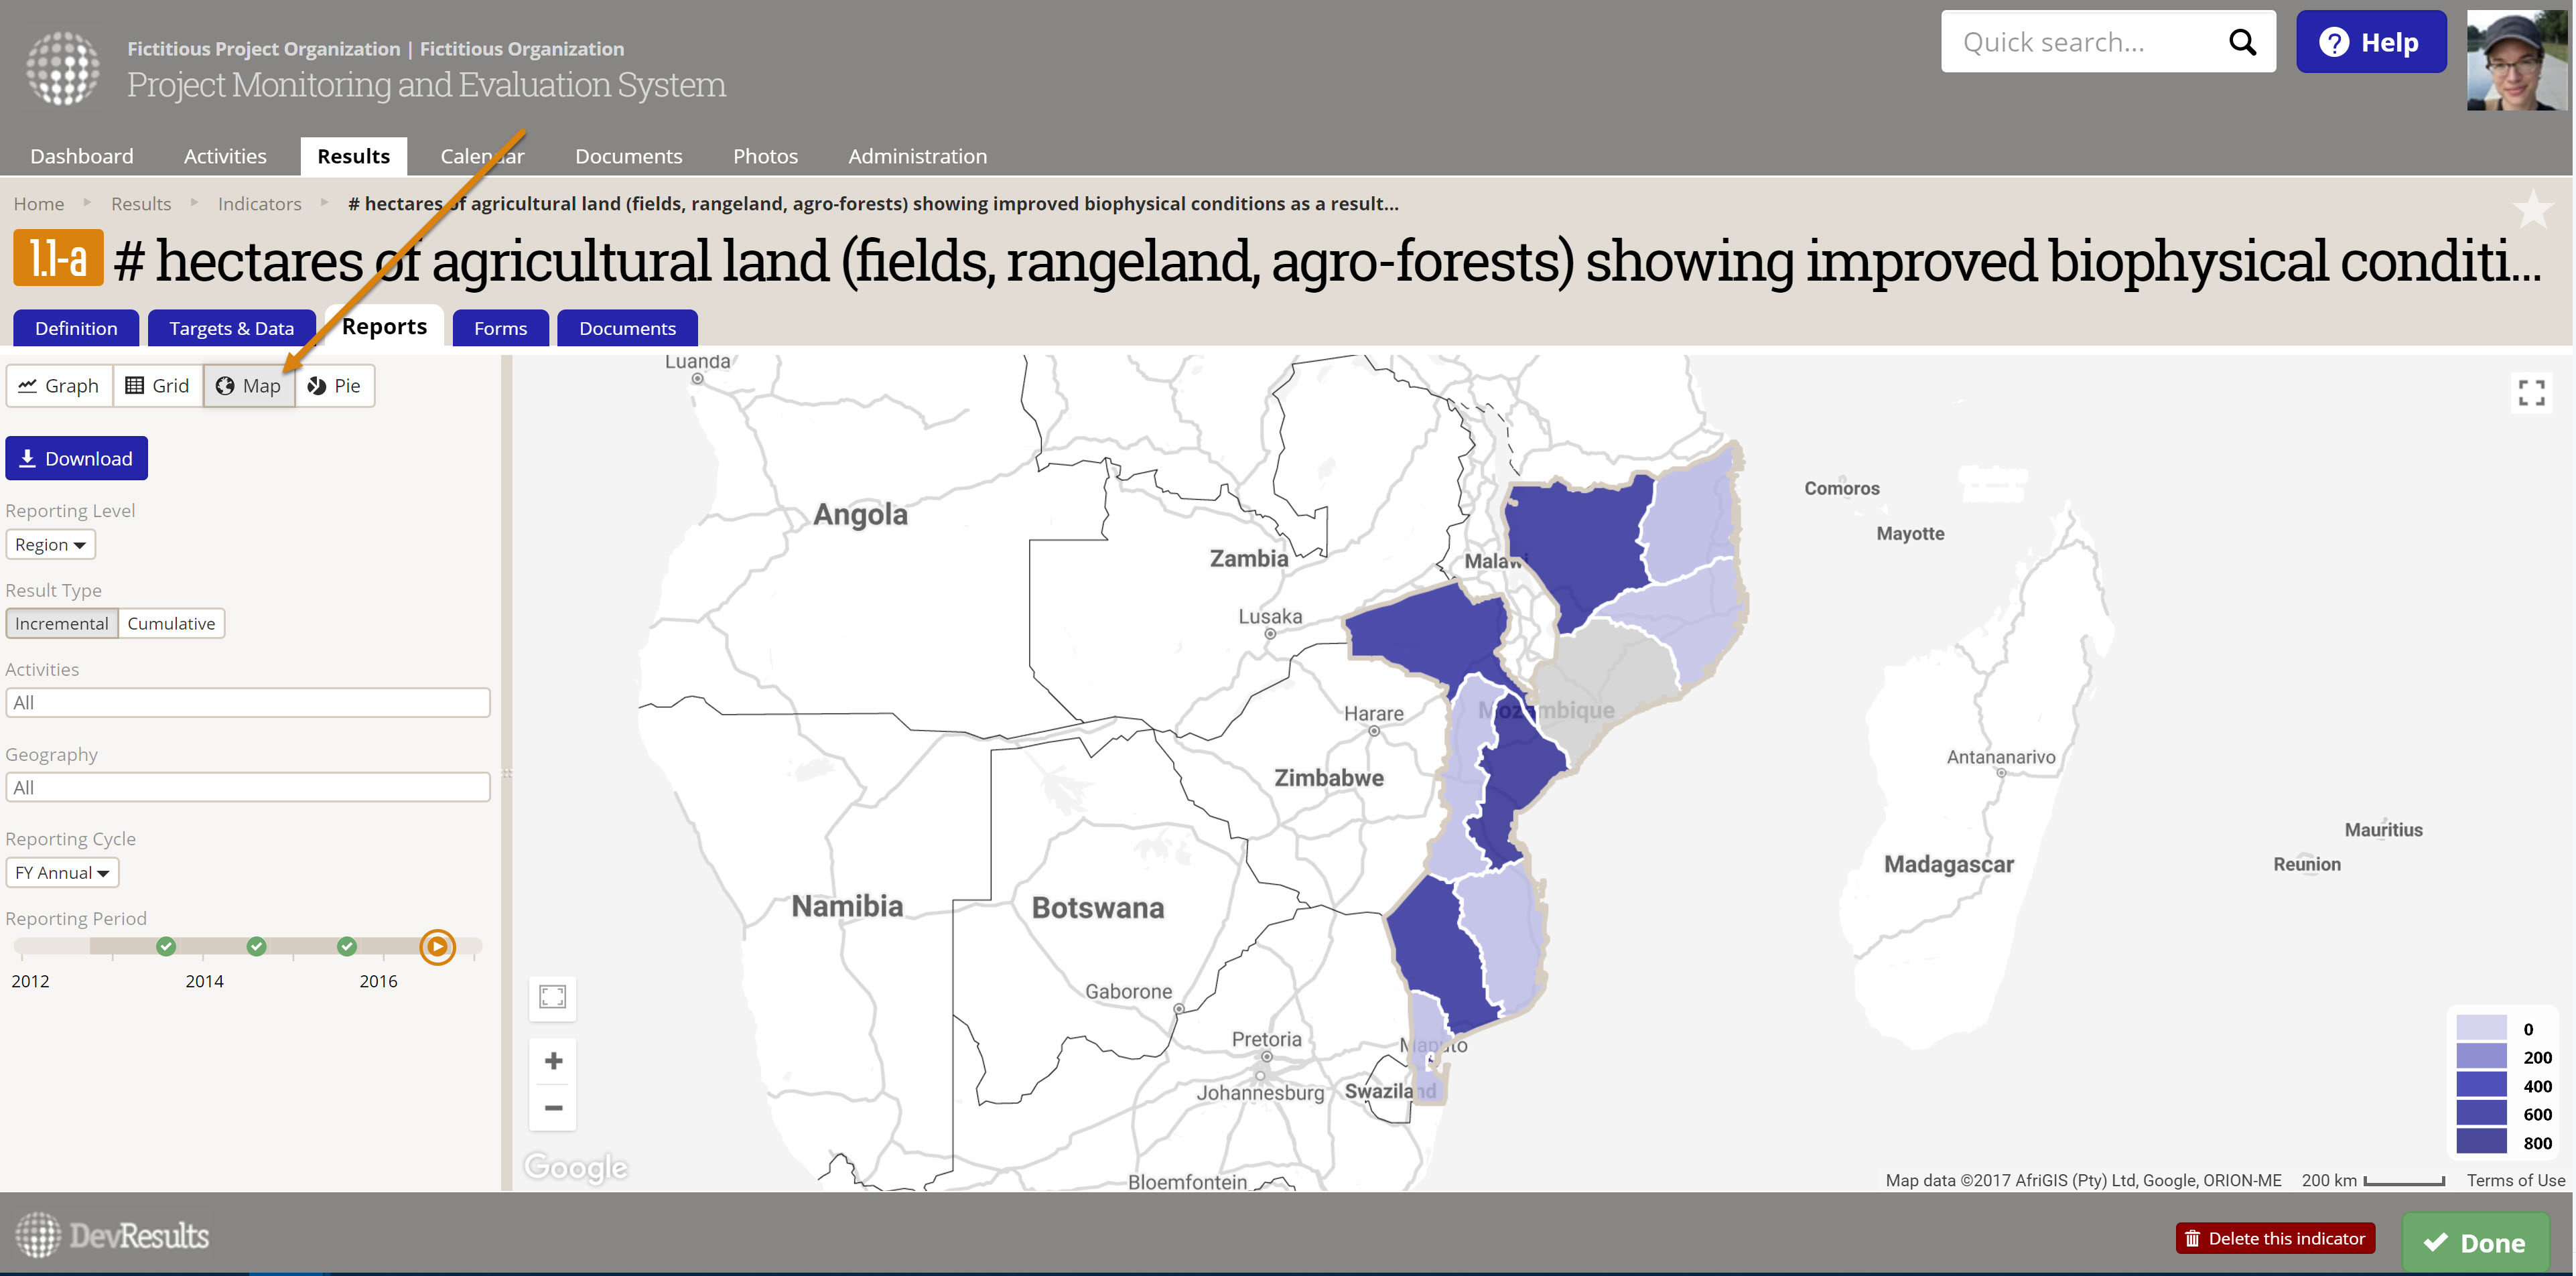 Use the left-hand configuration panel to make configuration selections and download the map.
For the dashboard tile, hover over the Dashboard menu and click on New Dashboard (Beta). On your dashboard, click + Add Tile in the lower right. Use the Indicator Map tile option.
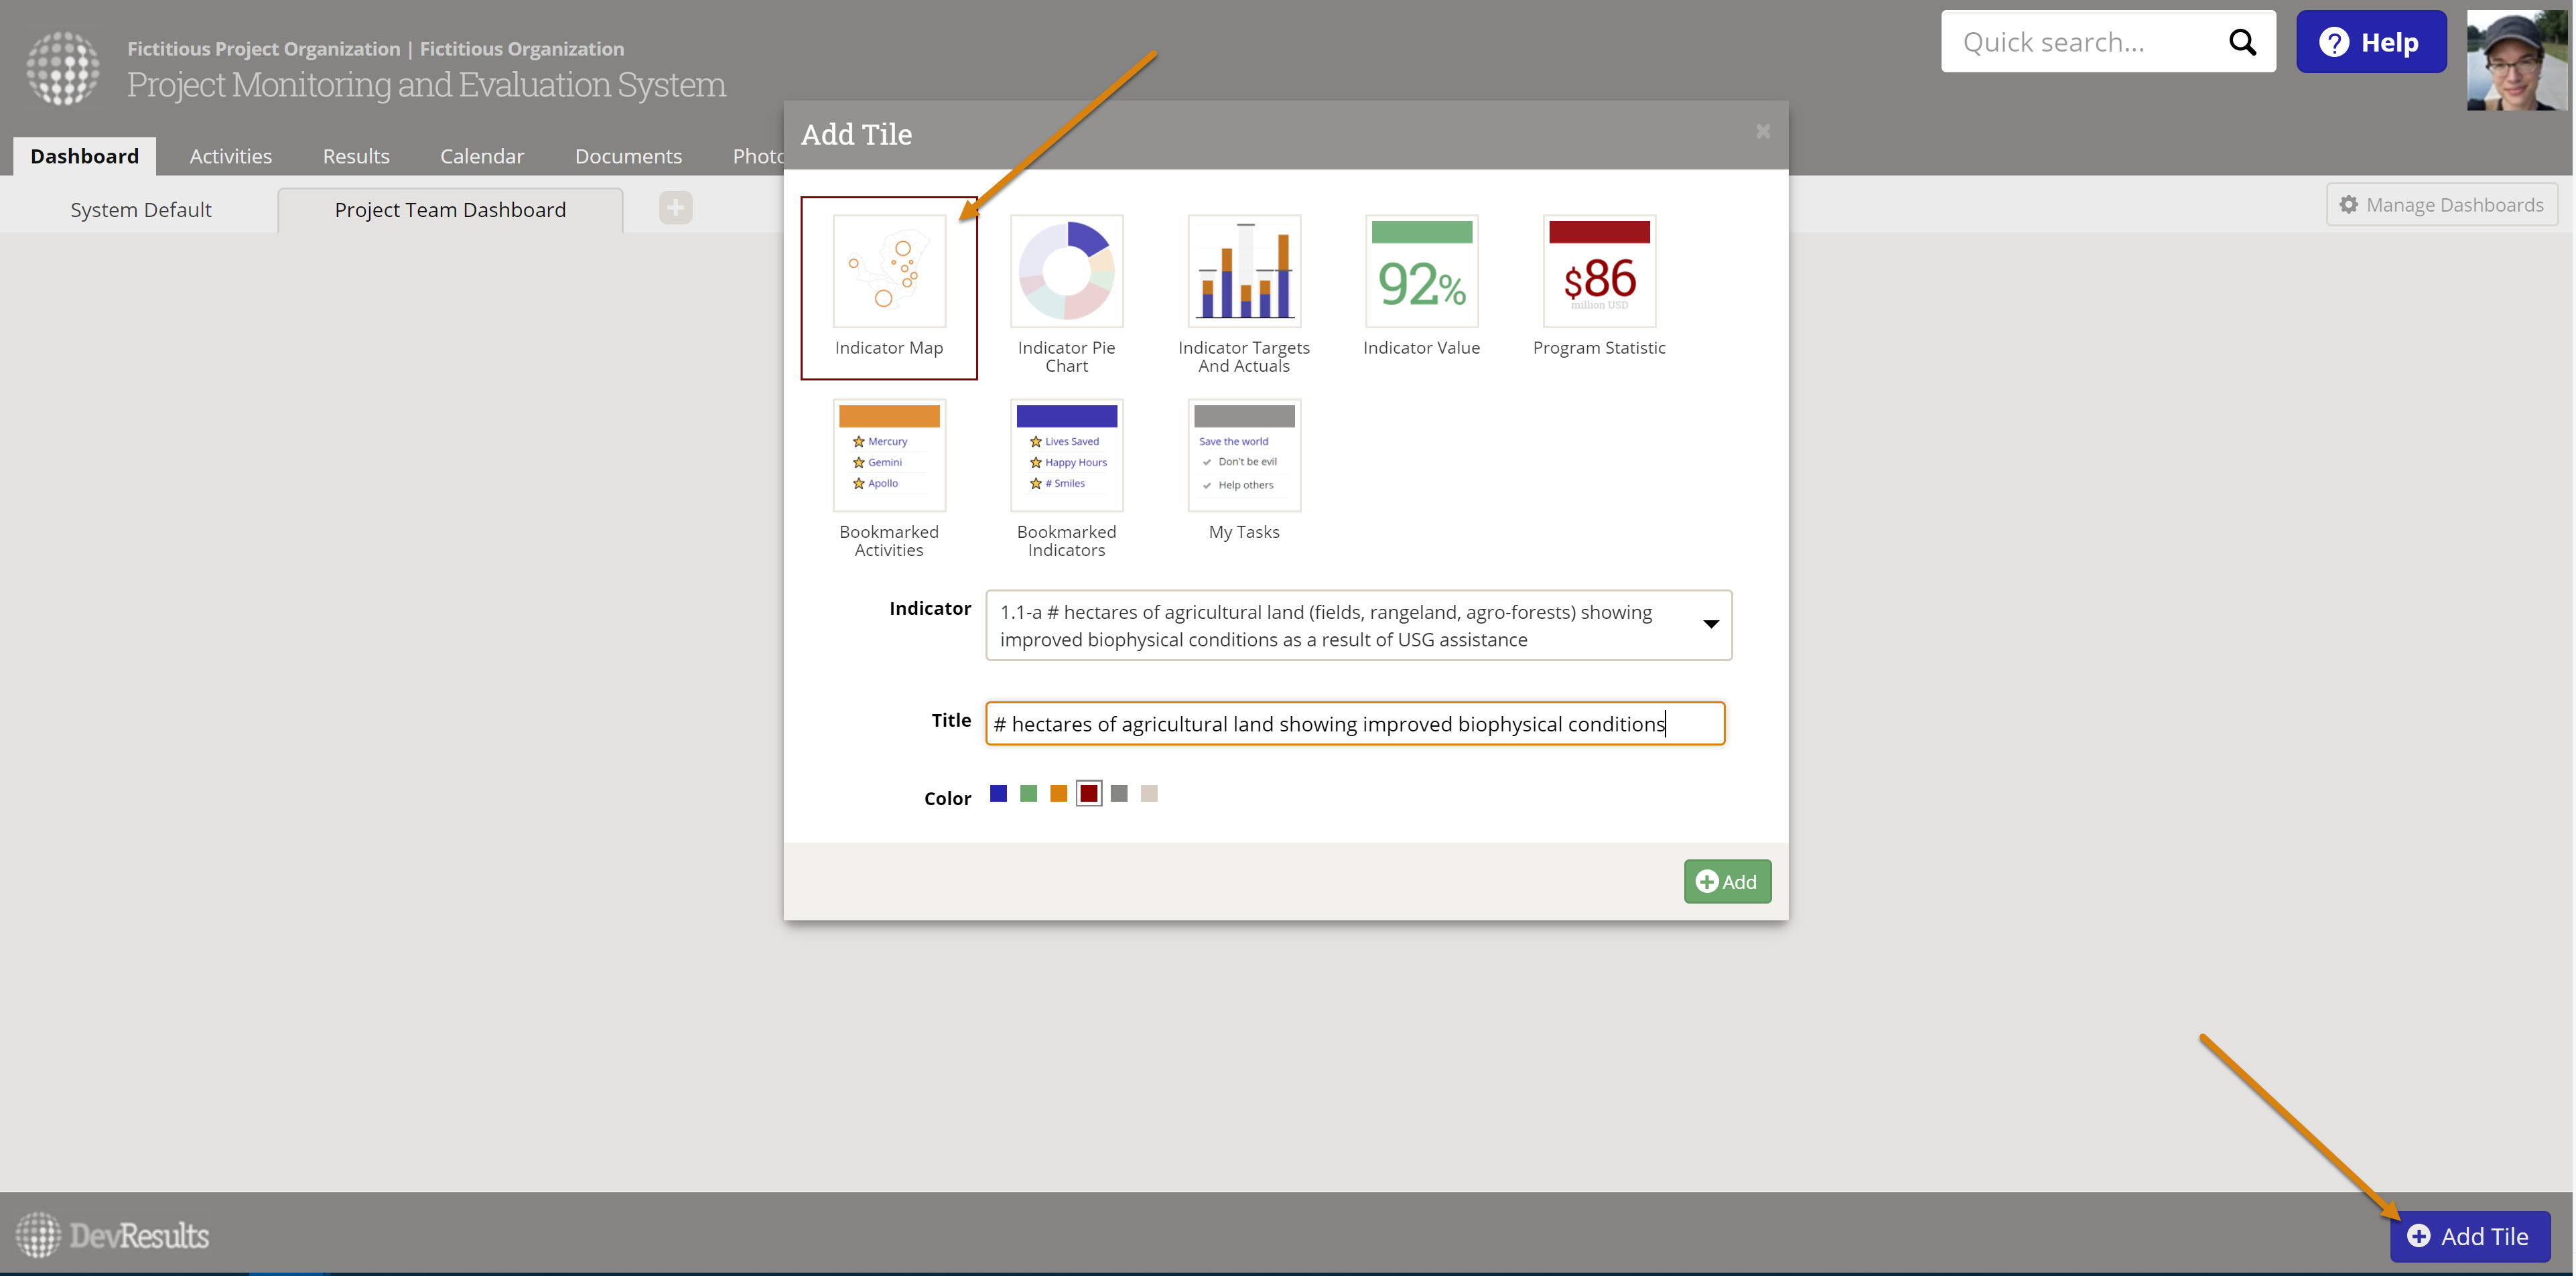 Click the gear icon in the upper left of the tile to open the left-hand configuration panel for configuration selections and download.
Added Perks
We also took the lessons we learned with the Google Map here and applied them to several other pages, which are now performing faster, too:
- Activity Geography tab
- Administration > Administrative Divisions
- Administrative Division details page
Where Our Viz Is Going
Next up on visualization rewrites is one of our few remaining dashboard tile conversions: the Activity Map tile. We're building it using everything we learned in redoing Choropleth. Activity Map remains the last tile to be converted to New Dashboard, so we'll be officially releasing the new dashboards and slowly phasing out the old ones once we have this tile available!
Site owners and advance notice recipients, you'll be getting an email from me with details on those changes once we have established dates for the transition.