We're proud to announce the unveiling of our new, improved Indicator Definition page. The Indicator Definition page contains a lot of the rules and logic that dictate how DevResults calculates and displays indicator performance data. So updating this page touched many corners in the site and prompted us to overhaul all kinds of behind-the-scenes calculations and logic. We're intensely proud of how much more user-friendly the page is now, and still have a list of improvements we plan to add.
Why the Changes?
We are gradually changing all of DevResults' pages to use Angular to improve page load times and overall performance, and we're taking this opportunity to streamline the user experience and make everything better, faster, and easier. The Indicator Definition page was an obvious high priority because it gets used so often and has so many configuration options.
Here's what you need to know about the new, improved page:
1 The overall layout is the same
While we made huge overhauls under the covers and added some great functionality, the overall layout is the same. We didn't want to confuse or challenge you to learn something new.
2 Formula Indicators: A smarter and more helpful Formula Editor
I cannot say enough good things about this. Those of you using formula indicators will notice this change right away. Let's be honest: that interface was always pretty bare bones. We've made it smarter and more helpful in all kinds of ways:
Autocomplete/select when you start to type in the editor: No more having to manually look up or guess at component indicator codes. Now, when you start typing an indicator code in a square bracket, the editor will try to anticipate what you're looking for and bring up a matching list:
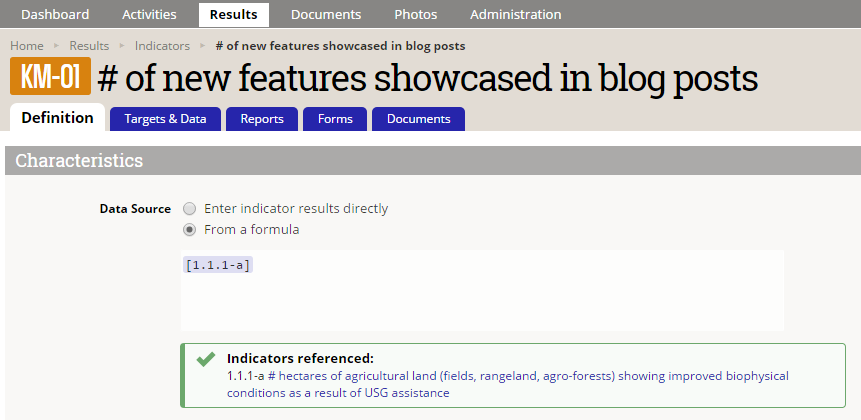
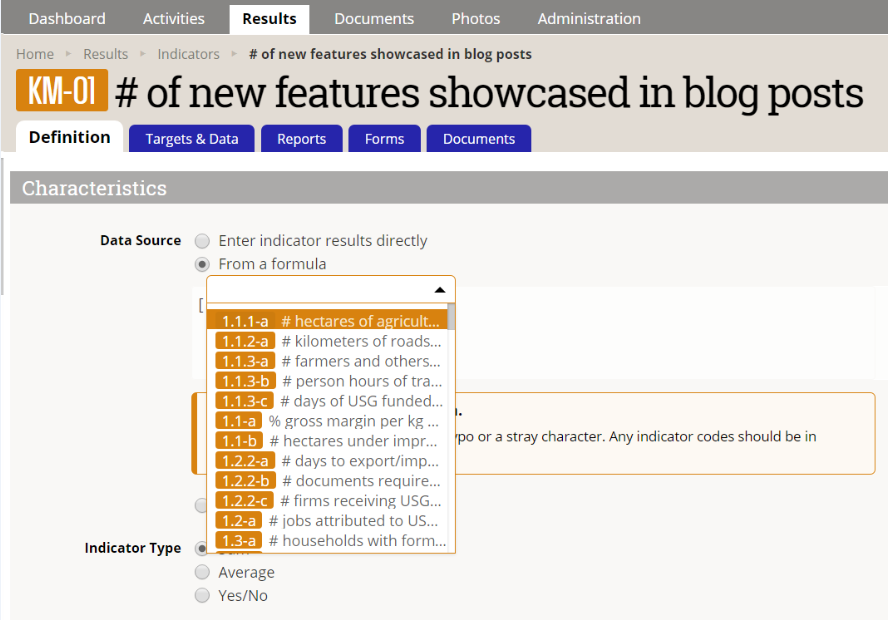 You can scroll through this list and pick the indicator you need. Once you've done so, the screen below will update to show you the details of the indicator you selected so you can be sure you picked the right one:
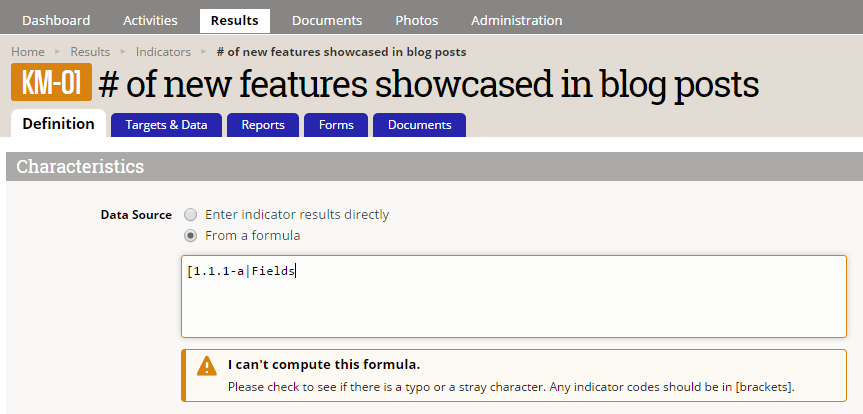
Autocomplete/select available disaggregations: Yup, no more having to remember the disaggregation title or worrying that you selected the wrong one. Now, once you've entered an indicator code in the bracket and you add the
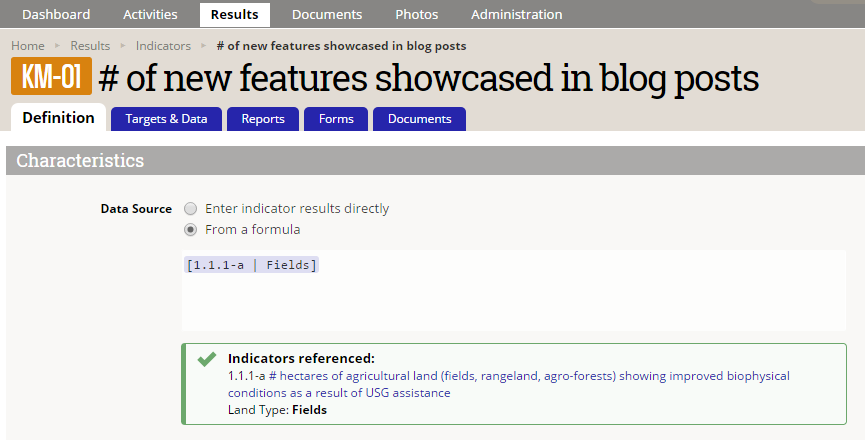
|to indicate you want to use a disaggregation, the system will give you a list of the disaggregations assigned to that indicator--and ONLY those disaggregations: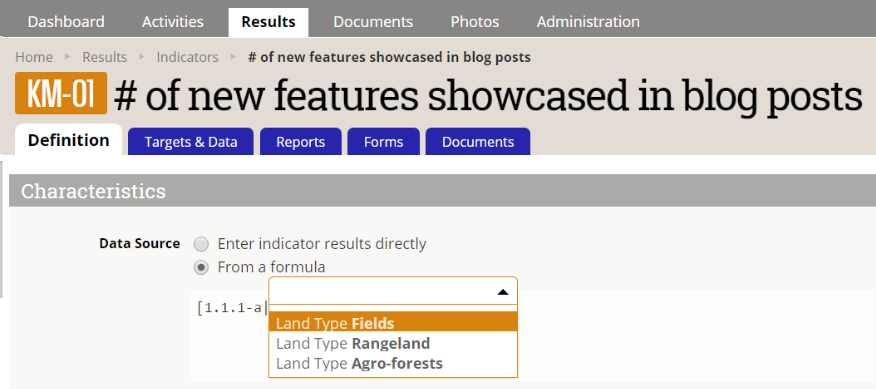 Again, as with the indicator code, once you've selected what you need, the screen below will update to show you the details of the indicator/disaggregation you selected so you can be sure you picked the right one. (Disaggregation name and selected attribute are at the bottom):
Warning when a formula won't compute: No more guessing if the formula will calculate; now we'll tell you if it can't based on a typo or an incomplete bracket:
3 Formula Indicators: Preventing bad changes to indicators
In addition to a better formula editor, we've also added some great new logic and limits on what you can and can't add to a formula indicator. All of this is with a single goal: to make it easier for you to configure them and make it much harder to make changes that break them. This includes:
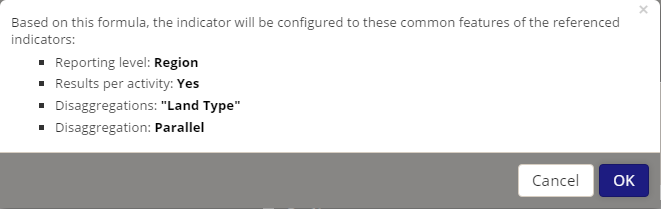
Explanation of what your calculation will yield: This is one of my favorite additions to the interface. What we've always done behind the scenes is to try to find the things that component indicators have in common, and to use the overlap as the settings for the formula indicator. This includes things like: disaggregations, reporting level, whether it's reported per activity or not. But we'd hidden those things from you. Now, we're exposing them so you can truly see what you'll get based on the formula. Once you've entered a valid formula and you Tab or click out of the editor, you'll get a pop-up that will explain what we found the referenced indicators to have in common and, therefore, what will be used for this formula indicator. If these are what you expect, click OK. If they are totally wrong, click Cancel--this will take you back to the last valid formula and you can make changes:
Restrictions on valid Disaggregations and Reporting Levels: This IS my favorite addition to formula indicators: now, you can only select disaggregations and reporting levels that your formula's component indicators have in common. We found many clients would assign a disaggregation or a reporting level to a formula that was NOT used by all indicators referenced in the formula. This meant that their formula indicator never calculated. We've now made this impossible--you can only assign disaggregations and reporting levels that exist in all component indicators. (By default, we add the disaggregations and pick the most granular reporting level they have in common, but you can remove the disaggregations and select a higher reporting level.)
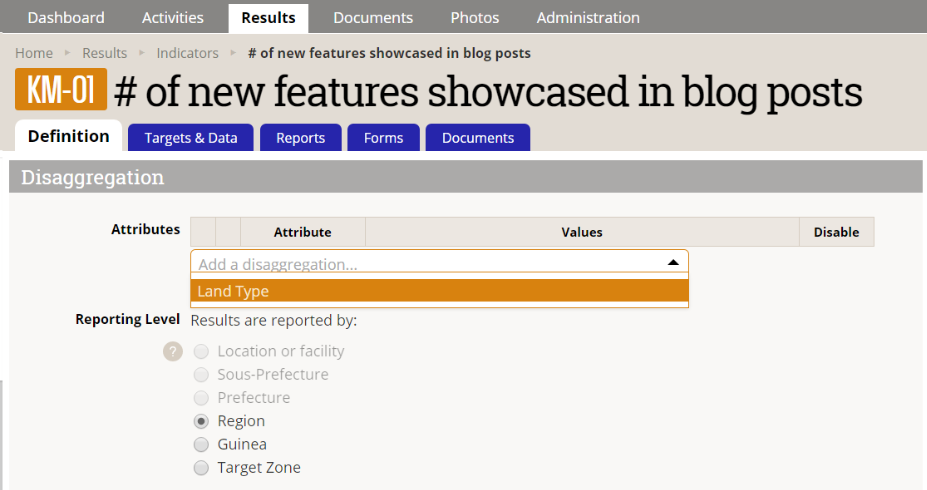 For example, in the formula above, the only disaggregation my component indicators have in common is Land Type, so that's the only one I can add or remove. And the lowest reporting level they have in common is Region, so I can't select Location or facility, Sous-Prefecture, or Prefecture. By default, the system picked Region, but I can always pick a higher reporting level, like Guinea or Target Zone.
4 Indicator & Logic Check Dependencies
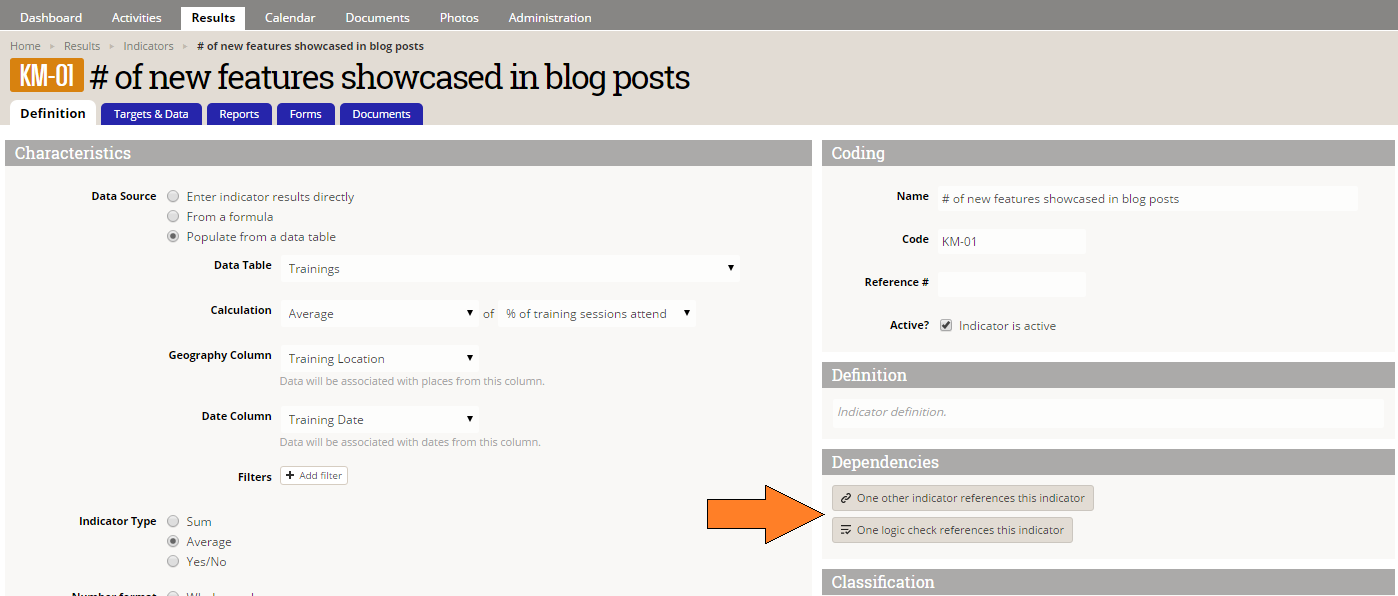
Another favorite addition: now, when an indicator is referenced by another indicator's formula or by a logic check, a Dependencies section appears on the Indicator Definition screen to let you know. You can click the buttons here to open a list of indicators and/or logic checks that depend on this indicator--that way, if you make changes to this indicator, you know which formula indicators you need to go update.
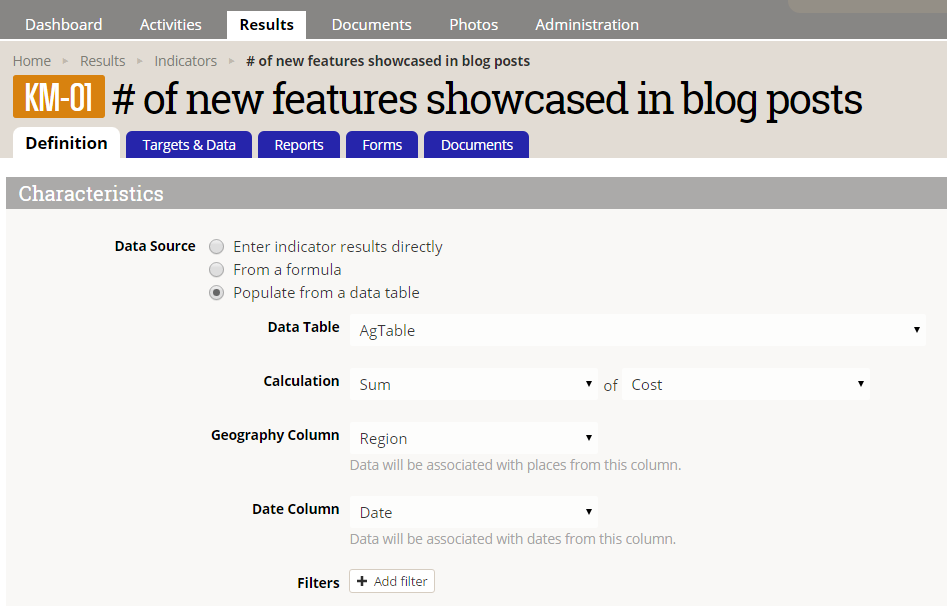
5 Data Table Indicators: Improved data table mapping interface
As with the Formula Editor, we've worked to make this more obvious and intuitive, and to display all the details of a data table indicator mapping when you're looking at the indicator. The mapping used to be largely hidden in a pop-up; now we're displaying it front and center on the page:
- Changes made in these dropdowns are auto-saved and undoable (rather than the all-or-nothing approach we had in the pop-up).
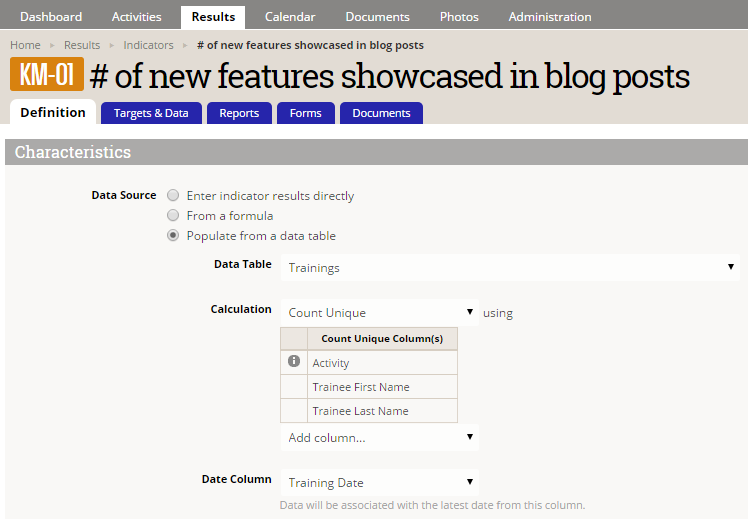
- For Count Unique, the old interface often didn't show all the columns it was factoring into the Count. We've made sure it's doing that consistently at all times now:
6 Data Table Indicators: Now can be percentages
Previously, even if you had a column in a data table defined as a percentage, you couldn't set a data table indicator linked to that column to be a percentage. We've fixed that oversight; now, if you have a data table indicator set as Average or Yes/No, you can set the Number Format to be a percentage.
7 More on-screen help when things aren't right
This is something we're working to do throughout the site: making it more obvious when something isn't configured properly. You've already seen examples of this with the formula indicators; another example is when an indicator isn't mapped to a results framework:

What's Next?
We're still hard at work on other fantastic improvements to this page, so stay tuned to future monthly blog posts for those updates.
Please email us if you have any questions or feedback on these improvements!