Last year, we made significant improvements to indicator reports with our Matrix feature. This year, we've expanded it to work with multiple indicators!
What's new?
In addition to bringing the functionality you know and love to reports with multiple indicators, we added a few extra touches to make it easier than ever to make and share the reports you need.
Disaggregation Category Combinations
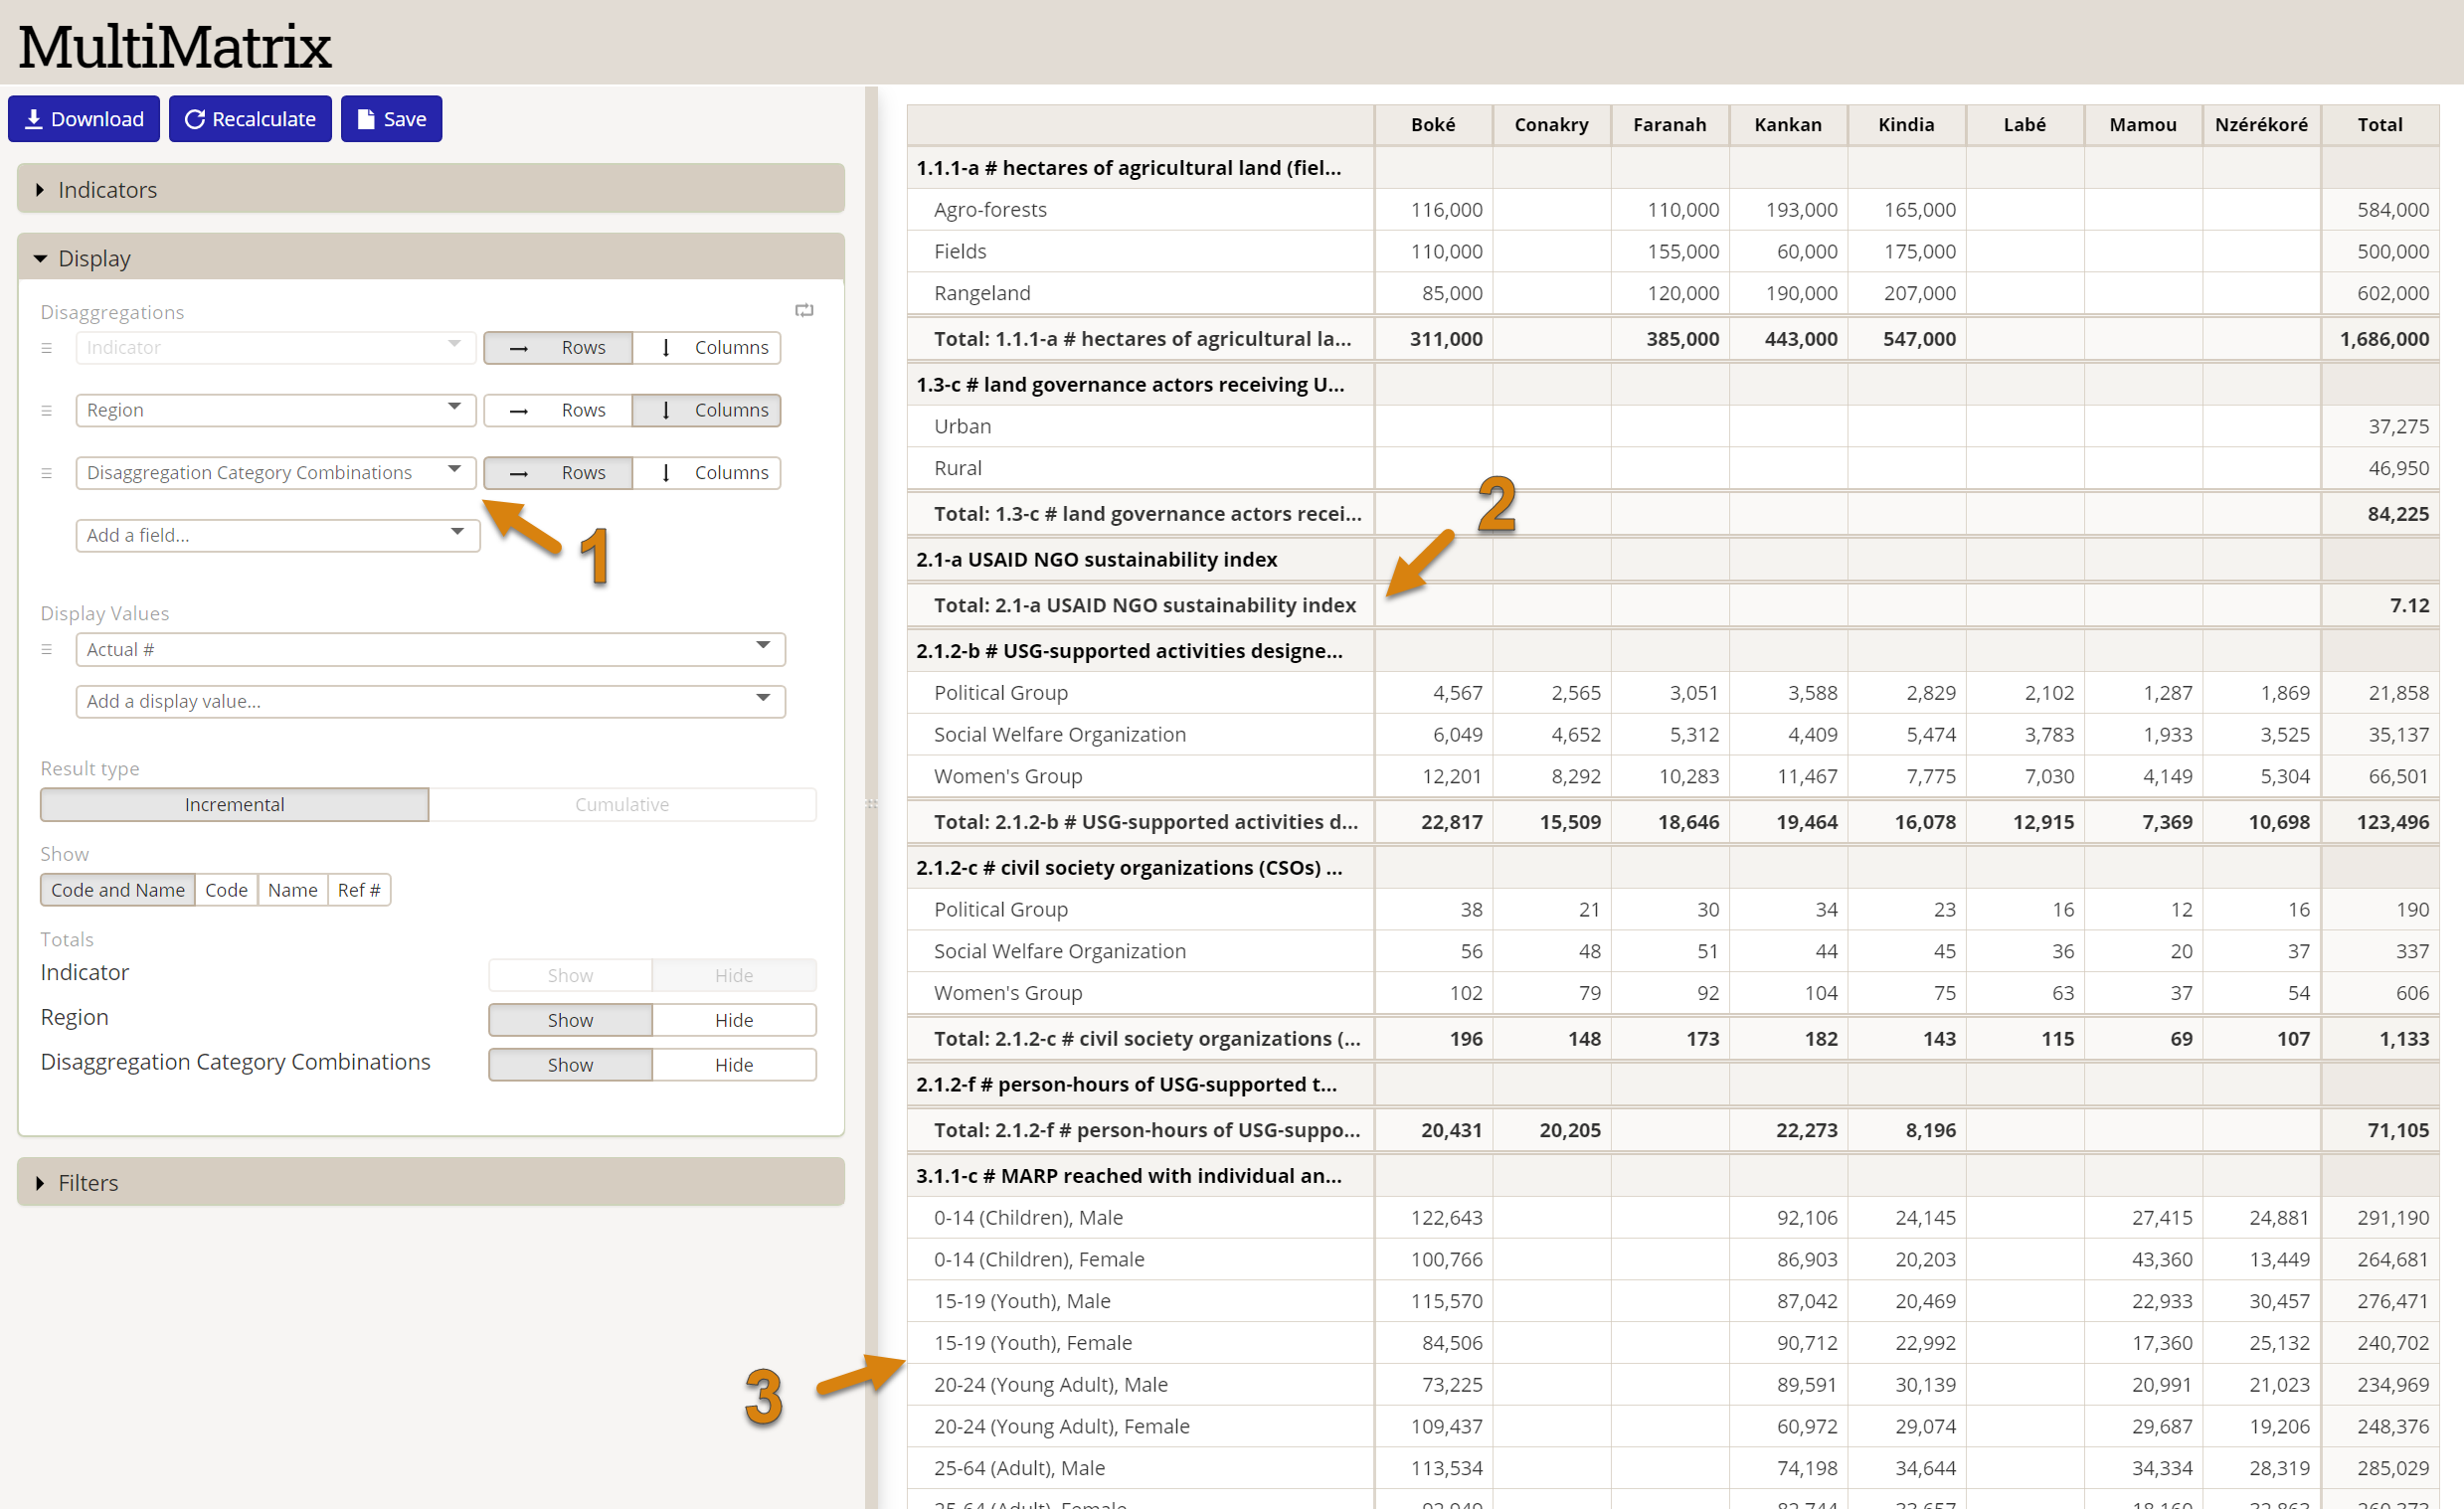
Ever need to make a report with multiple indicators that have completely different disaggregations? "Disaggregation Category Combinations" are just what you need. Add it as a disaggregation(1) and every indicator will be displayed with each combination of disaggregations. Indicators with no disaggregations will show no categories(2) while indicators with multiple disaggregations will show the complete disaggregation flattened to a single, comma-separated label(3).
Save as Dashboard
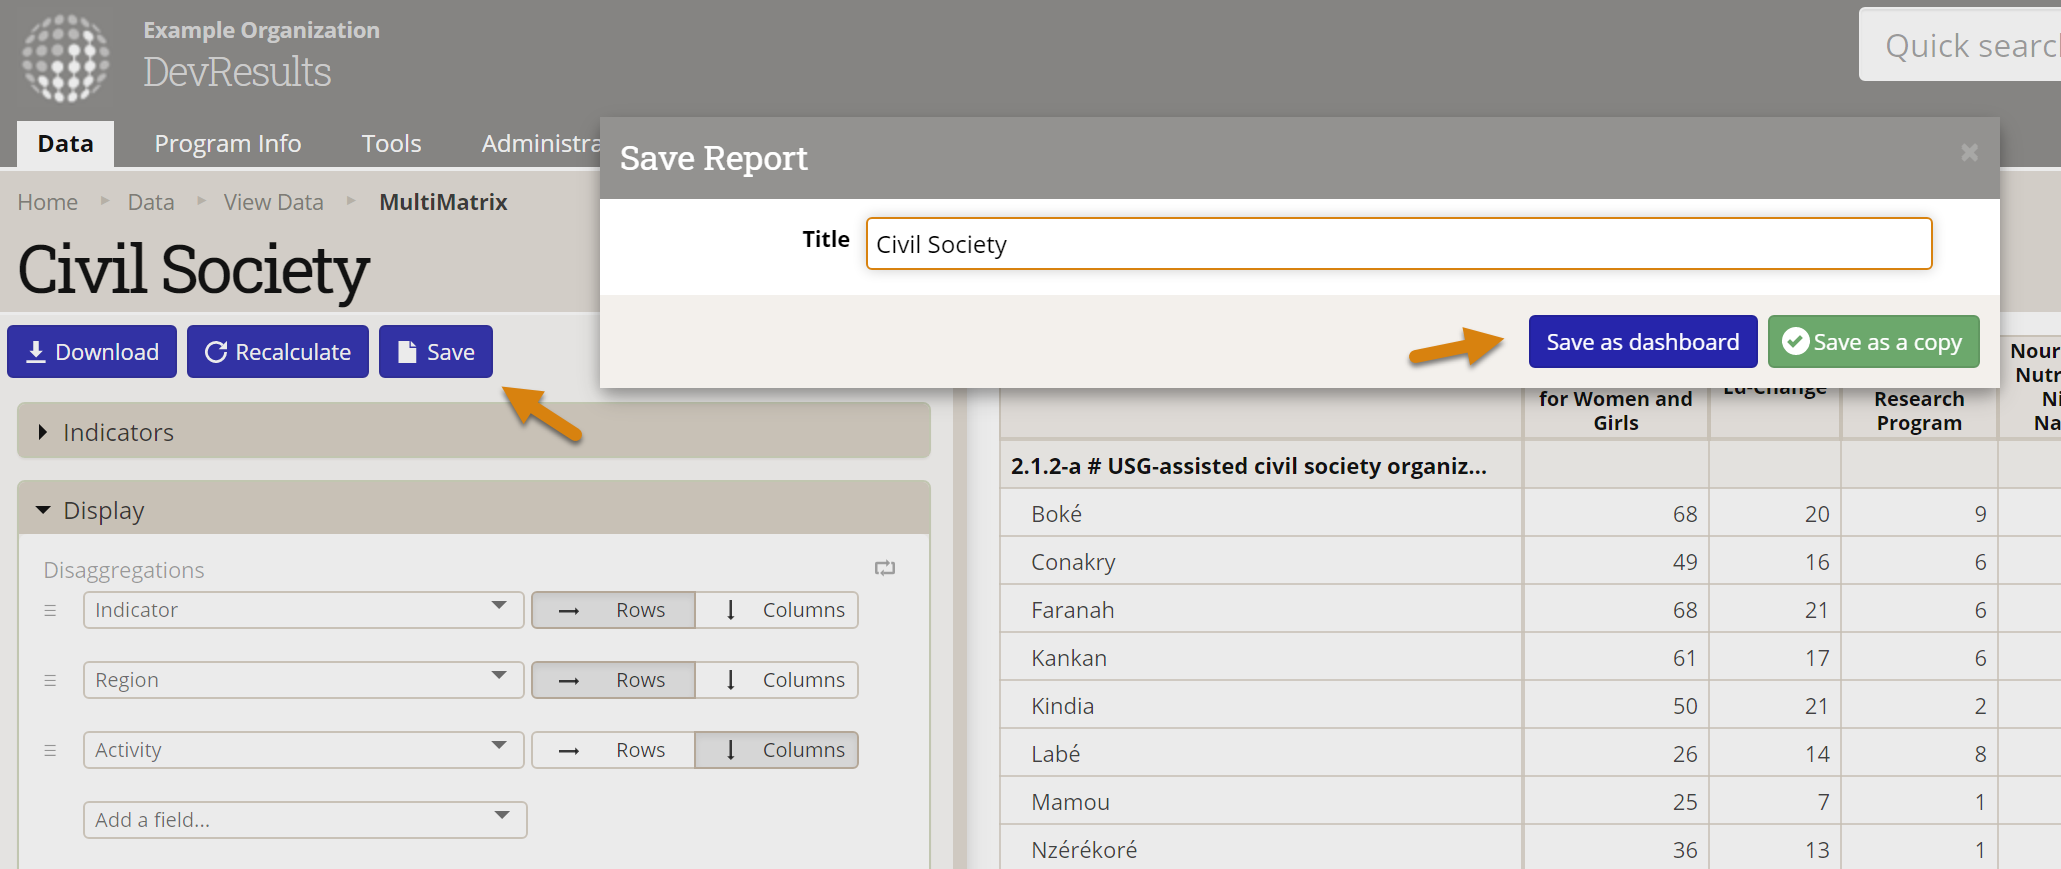
Let's say you've created a report you like, and you want to make sure it's prominent and easily accessible to other members of your DevResults site. MultiMatrix reports can be converted to Dashboards by clicking the Save button and choosing "Save as Dashboard".
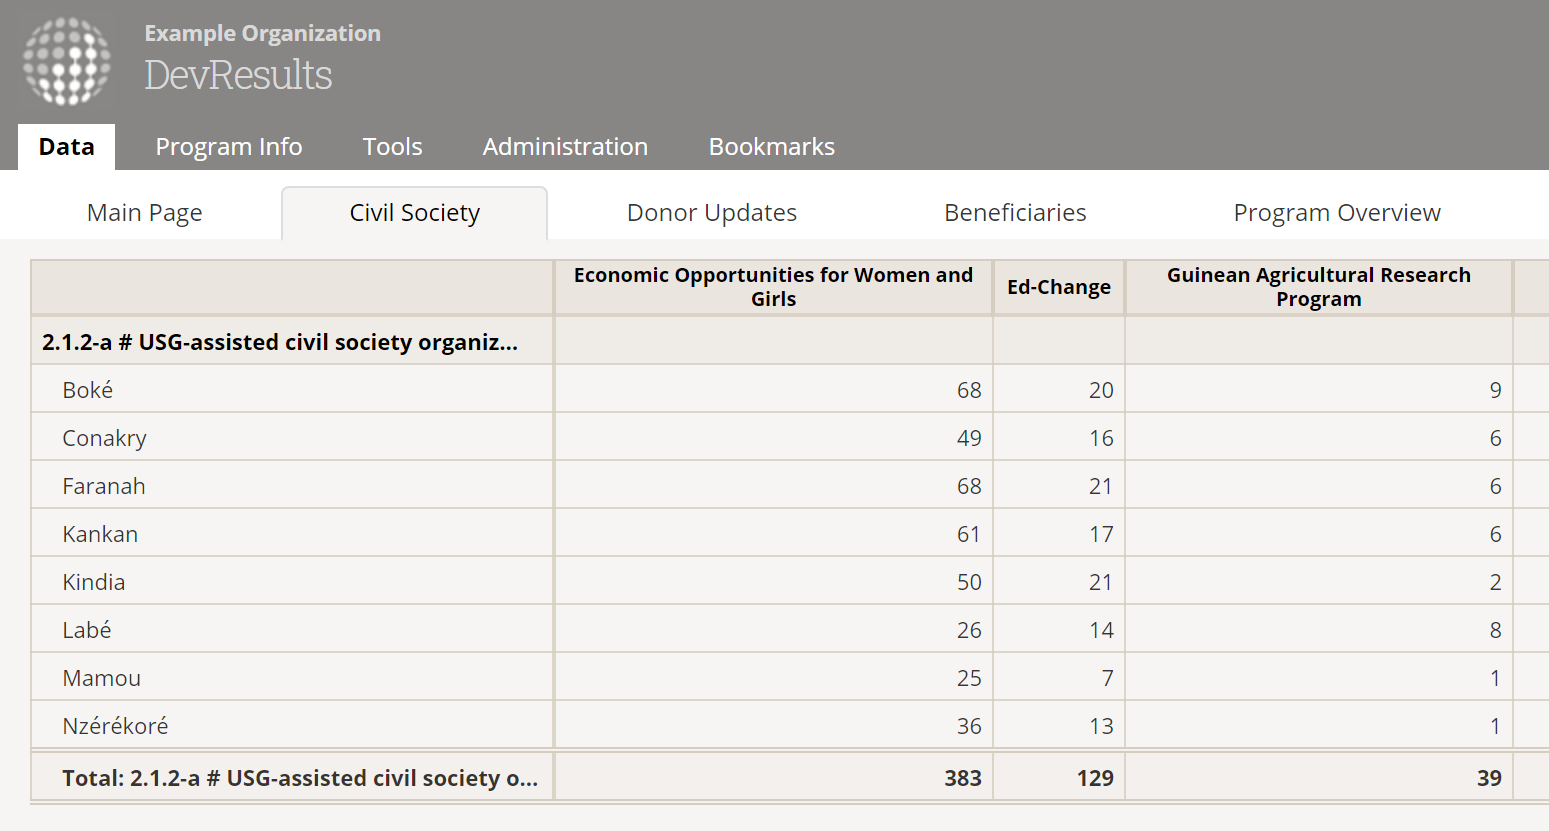
Once the report is saved as a dashboard, you can do the same things you can do with Tiles dashboards like sharing with and pushing to specific users.
You can also create a new MultiMatrix dashboard right from the Dashboards page, by choosing "MultiMatrix" in the "Add a Dashboard" pop-up.
Partner Access
We believe that your implementing partners are more engaged the more they are able to investigate and analyze the data they are collecting and reporting. For all sites with the Partner Dashboards feature enabled, Partners can now create their own MultiMatrix dashboards and view dashboards pushed to them by Dashboard managers. Just like elsewhere in the site, the data they can view is filtered to just the Projects they have permission to see.
What about my saved Pito reports?
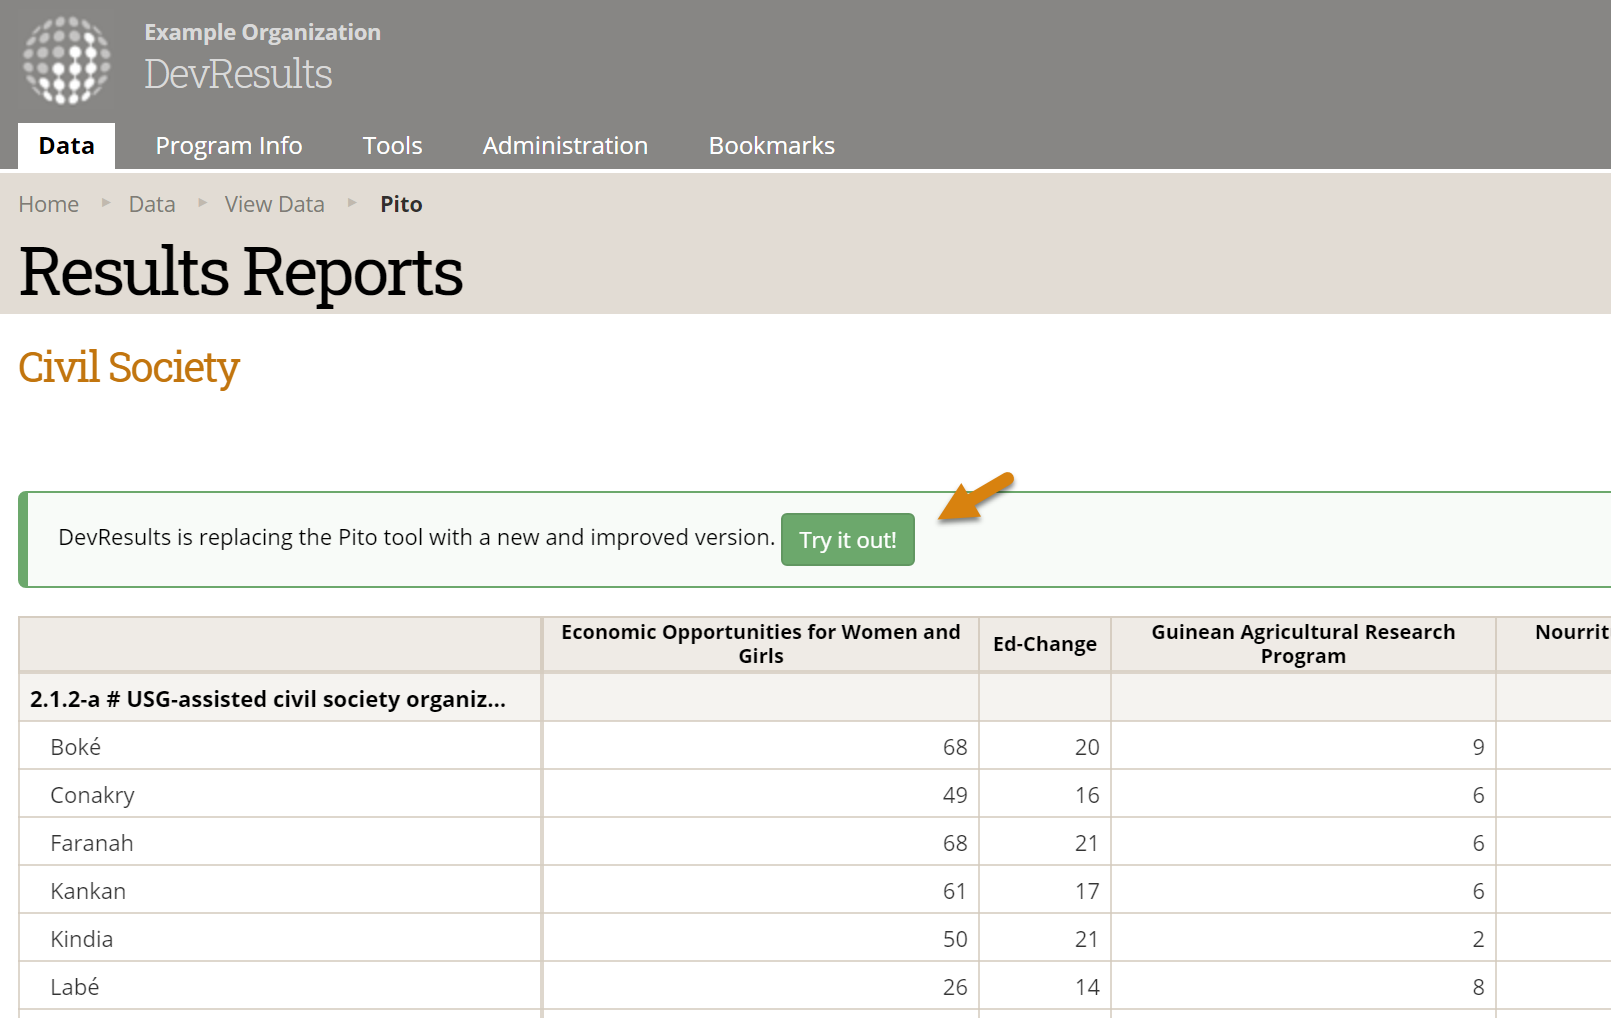
The old Pito tool will be permanently replaced with the MultiMatrix tool by July, 2020, and all existing Pito reports will be automatically migrated to MultiMatrix. Until that time, any users viewing a Pito report will see a banner letting them know about the planned deprecation of Pito and can click the button to view the same report in the MultiMatrix tool.
If, after viewing the report as MultiMatrix, you wish to keep the MultiMatrix version, you can choose to Save as a Copy or Save as a Dashboard. The original Pito report will remain unchanged, just in case.
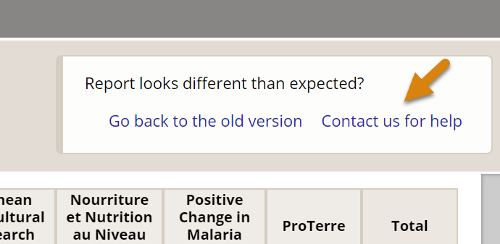
Because of the significant changes in functionality, and some of the limitations of the Pito tool, not every Pito report will look exactly as you expect in MultiMatrix. If you find that to be the case, please don't hesitate to reach out to us, and we'll help get your report migrated. There's a handy link at the top of the preview page to contact us.