We're pleased to announce the launch of our bulk editing tool for Activities and Indicators. Here's a few details on how it works, as well as some smaller changes in DevResults that you may not have noticed, including new formula and data table indicator diagnostics!
Bulk Editing Activities & Indicators
This year, we've been working to provide more functionality for site administrators to streamline common actions, like our work to support bulk imports on most index pages. We know how much of a time-saver it can be to upload and manage things in bulk. That's why we've been building upon the bulk import functionality with some bulk editing functionality. This is our first release of bulk edits, and we'd love to get your feedback.
1 Where Can I Do Bulk Edits?
You can currently do bulk edits on the Activities and Indicators Index pages. Here are the actions available on each page:
Activities Index
- Assign Indicators
- Assign Tags
- Assign Sectors
- Change Status
- Delete (don't worry; we'll make sure you actually want to first!)
Indicators Index
- Mark as Inactive
- Delete (don't worry; we'll make sure you actually want to first!)
Please let us know if there are other places you'd like bulk editing functionality or if you'd like to see more actions on either of these pages!
2 How Does It Work?
We've added two new elements to the index pages for bulk edits: a column for checkboxes (to select the items you want to edit), and a row of buttons across the top for available bulk edit actions:
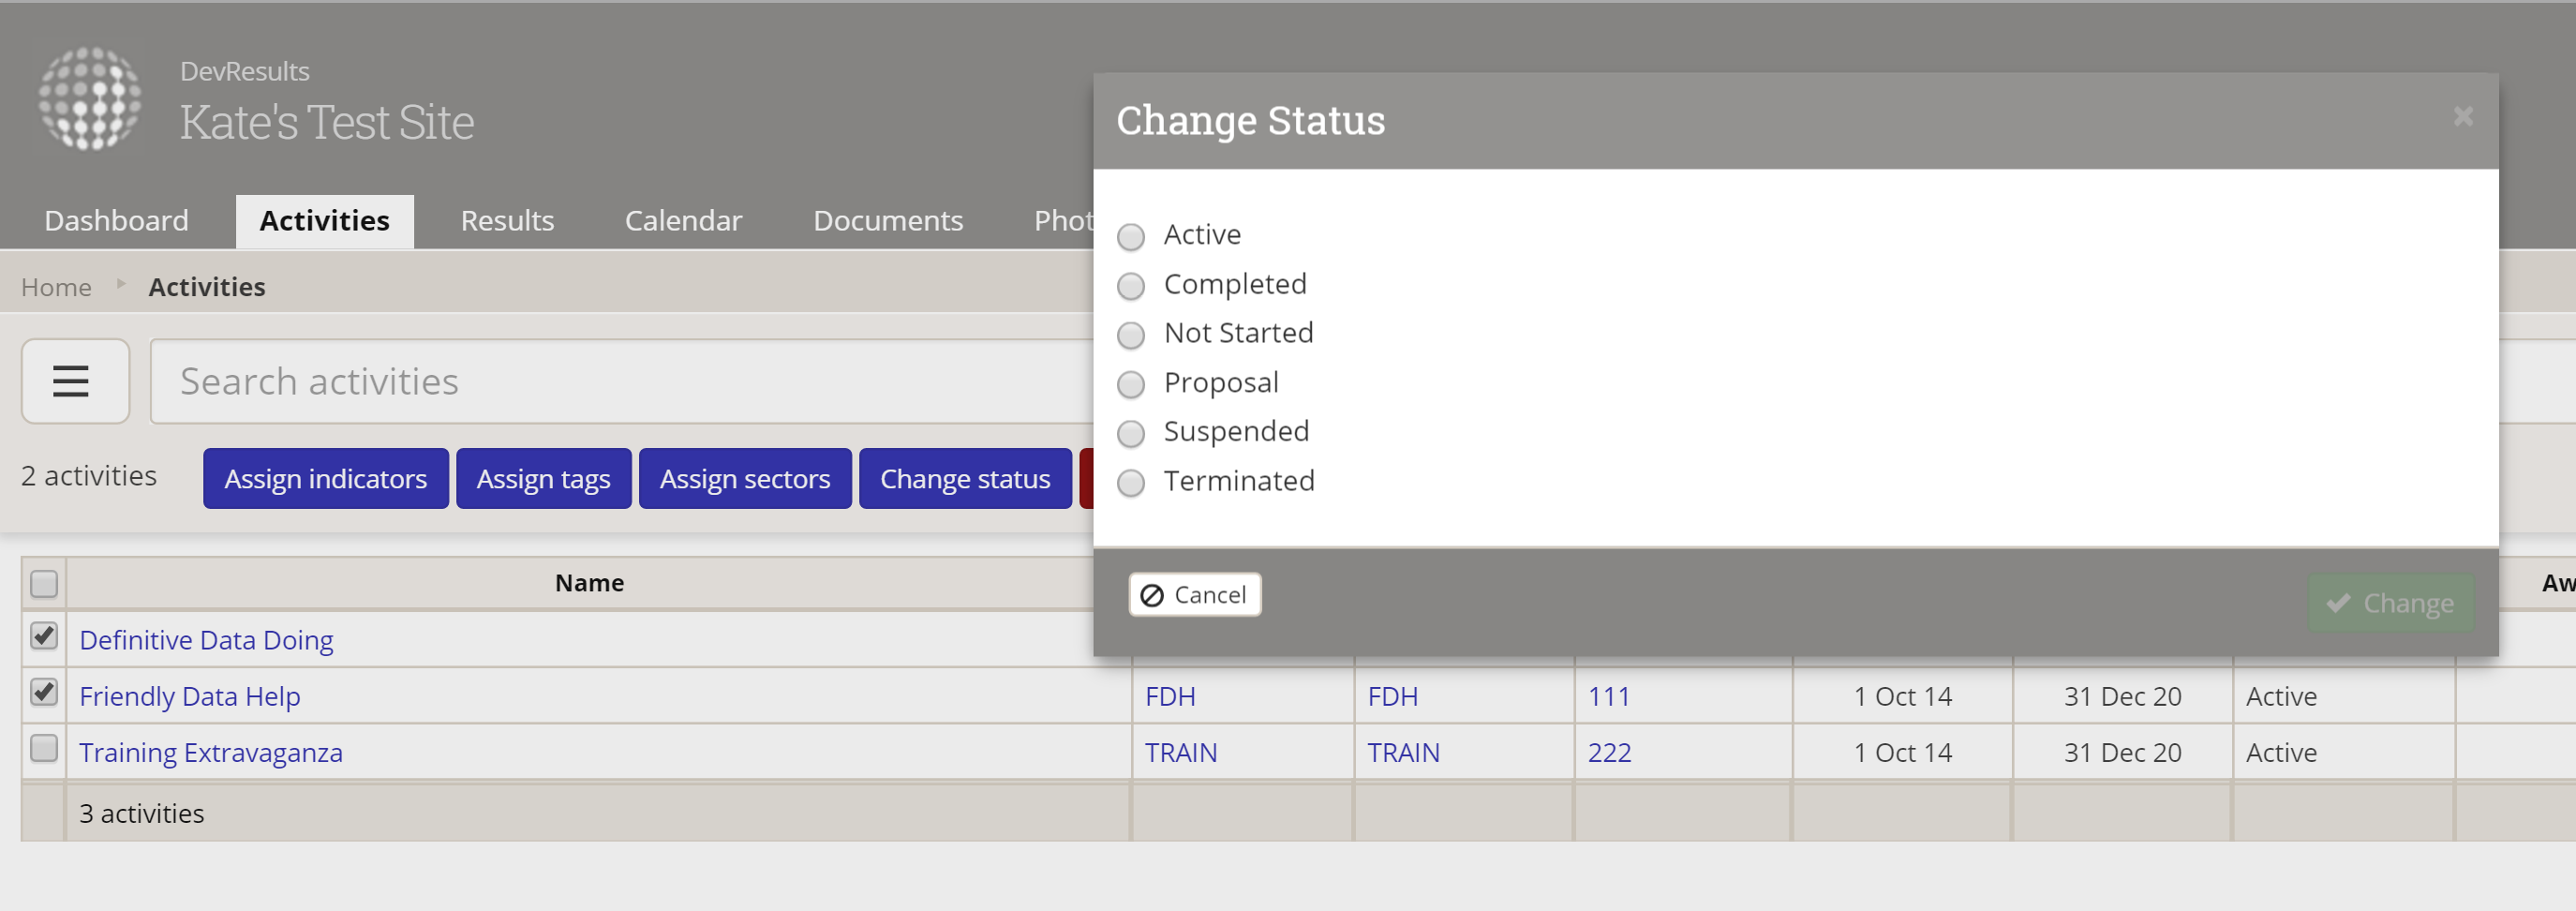
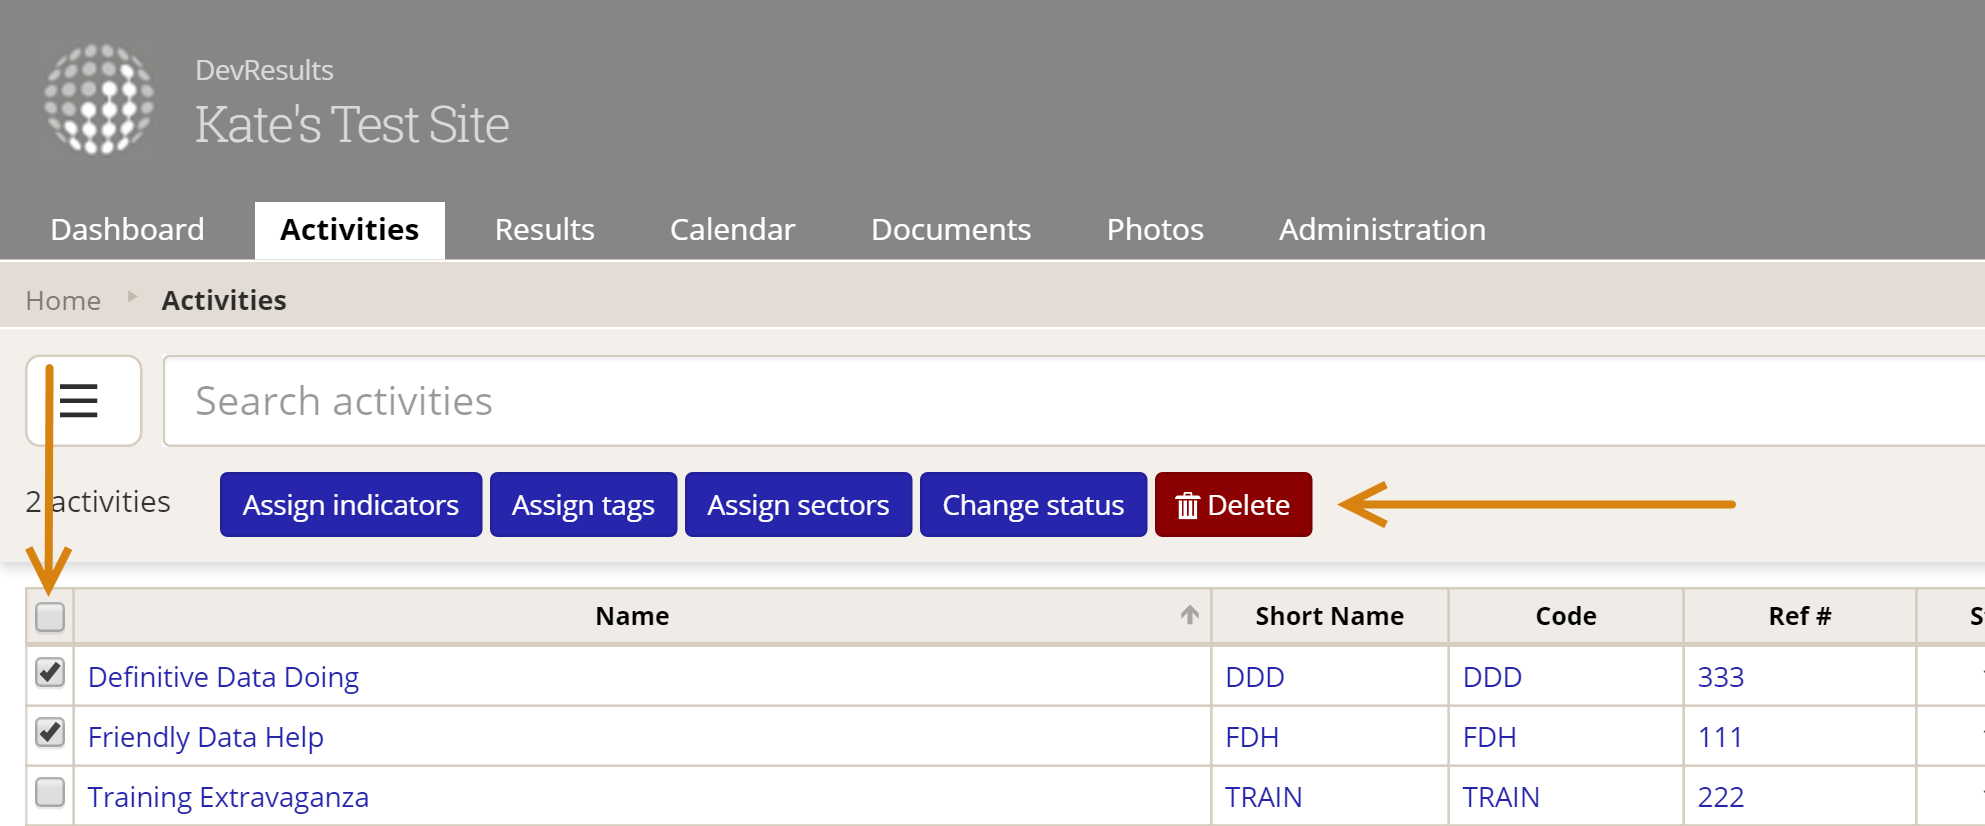 The buttons are unclickable until at least one item has been checked off (and they're hidden from users without appropriate permissions). Once you've selected at least one item, the buttons will be enabled. Clicking them will open a pop-up to help complete the action:
3 When Would I Want to Use This?
Here is where I get really excited--you can combine the index pages' abilities to filter and search with the bulk editing functionality. For example, let's say you've just been given a requirement to start tracking a new percentage indicator for all of your activities in the Health sector. You do smart data management (of course you do--you're a DevResults client!), so this actually means that you have three new indicators: one for the numerator, one for the denominator, and one to calculate the percentage itself so it'll be properly weighted over time.
So you have 3 new indicators which need to be assigned to all of your Health activities.
Before we added bulk editing capabilities, the fastest way to do this would have been to go into each of those three indicators and, with a list of your Health activities, assign each activity individually.
Now, with bulk editing capabilities, this is so fast it's fantastic:
- Use the filters in the index page's left-hand menu or in the search bar at the top to filter your activity list to Sector: Health.
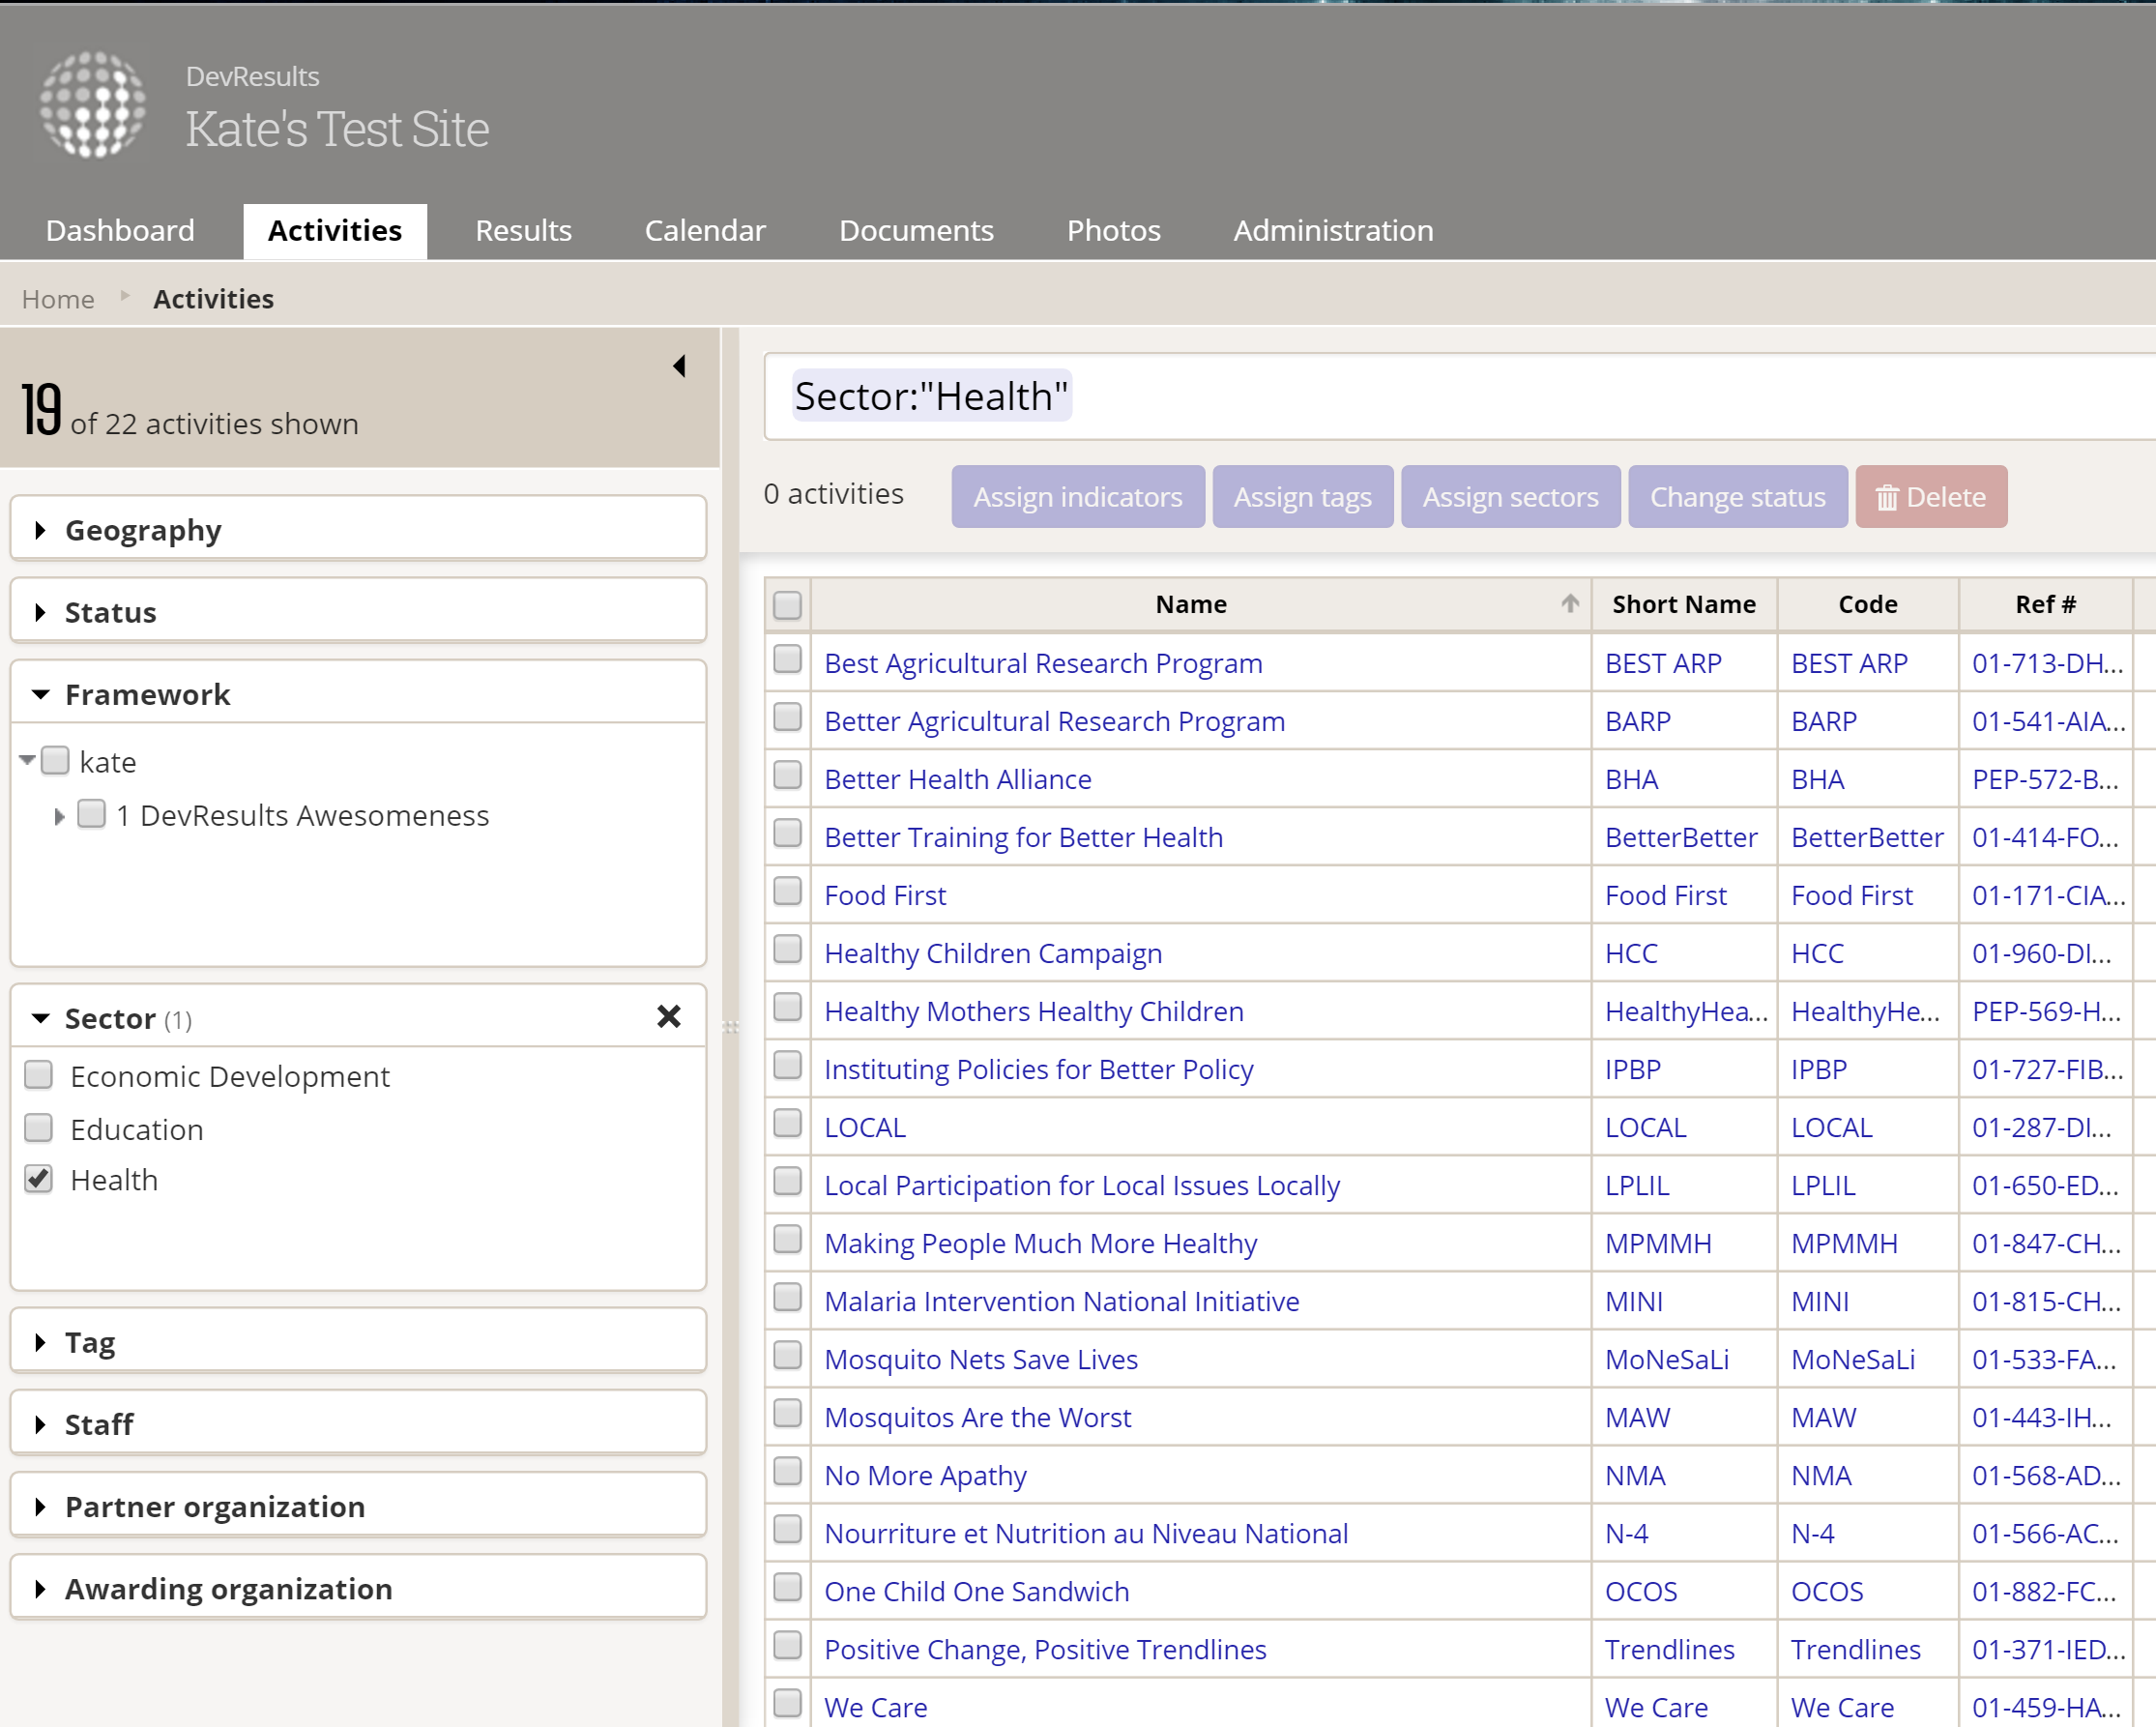
- Use the checkbox in the column header at the left to select all Activities.
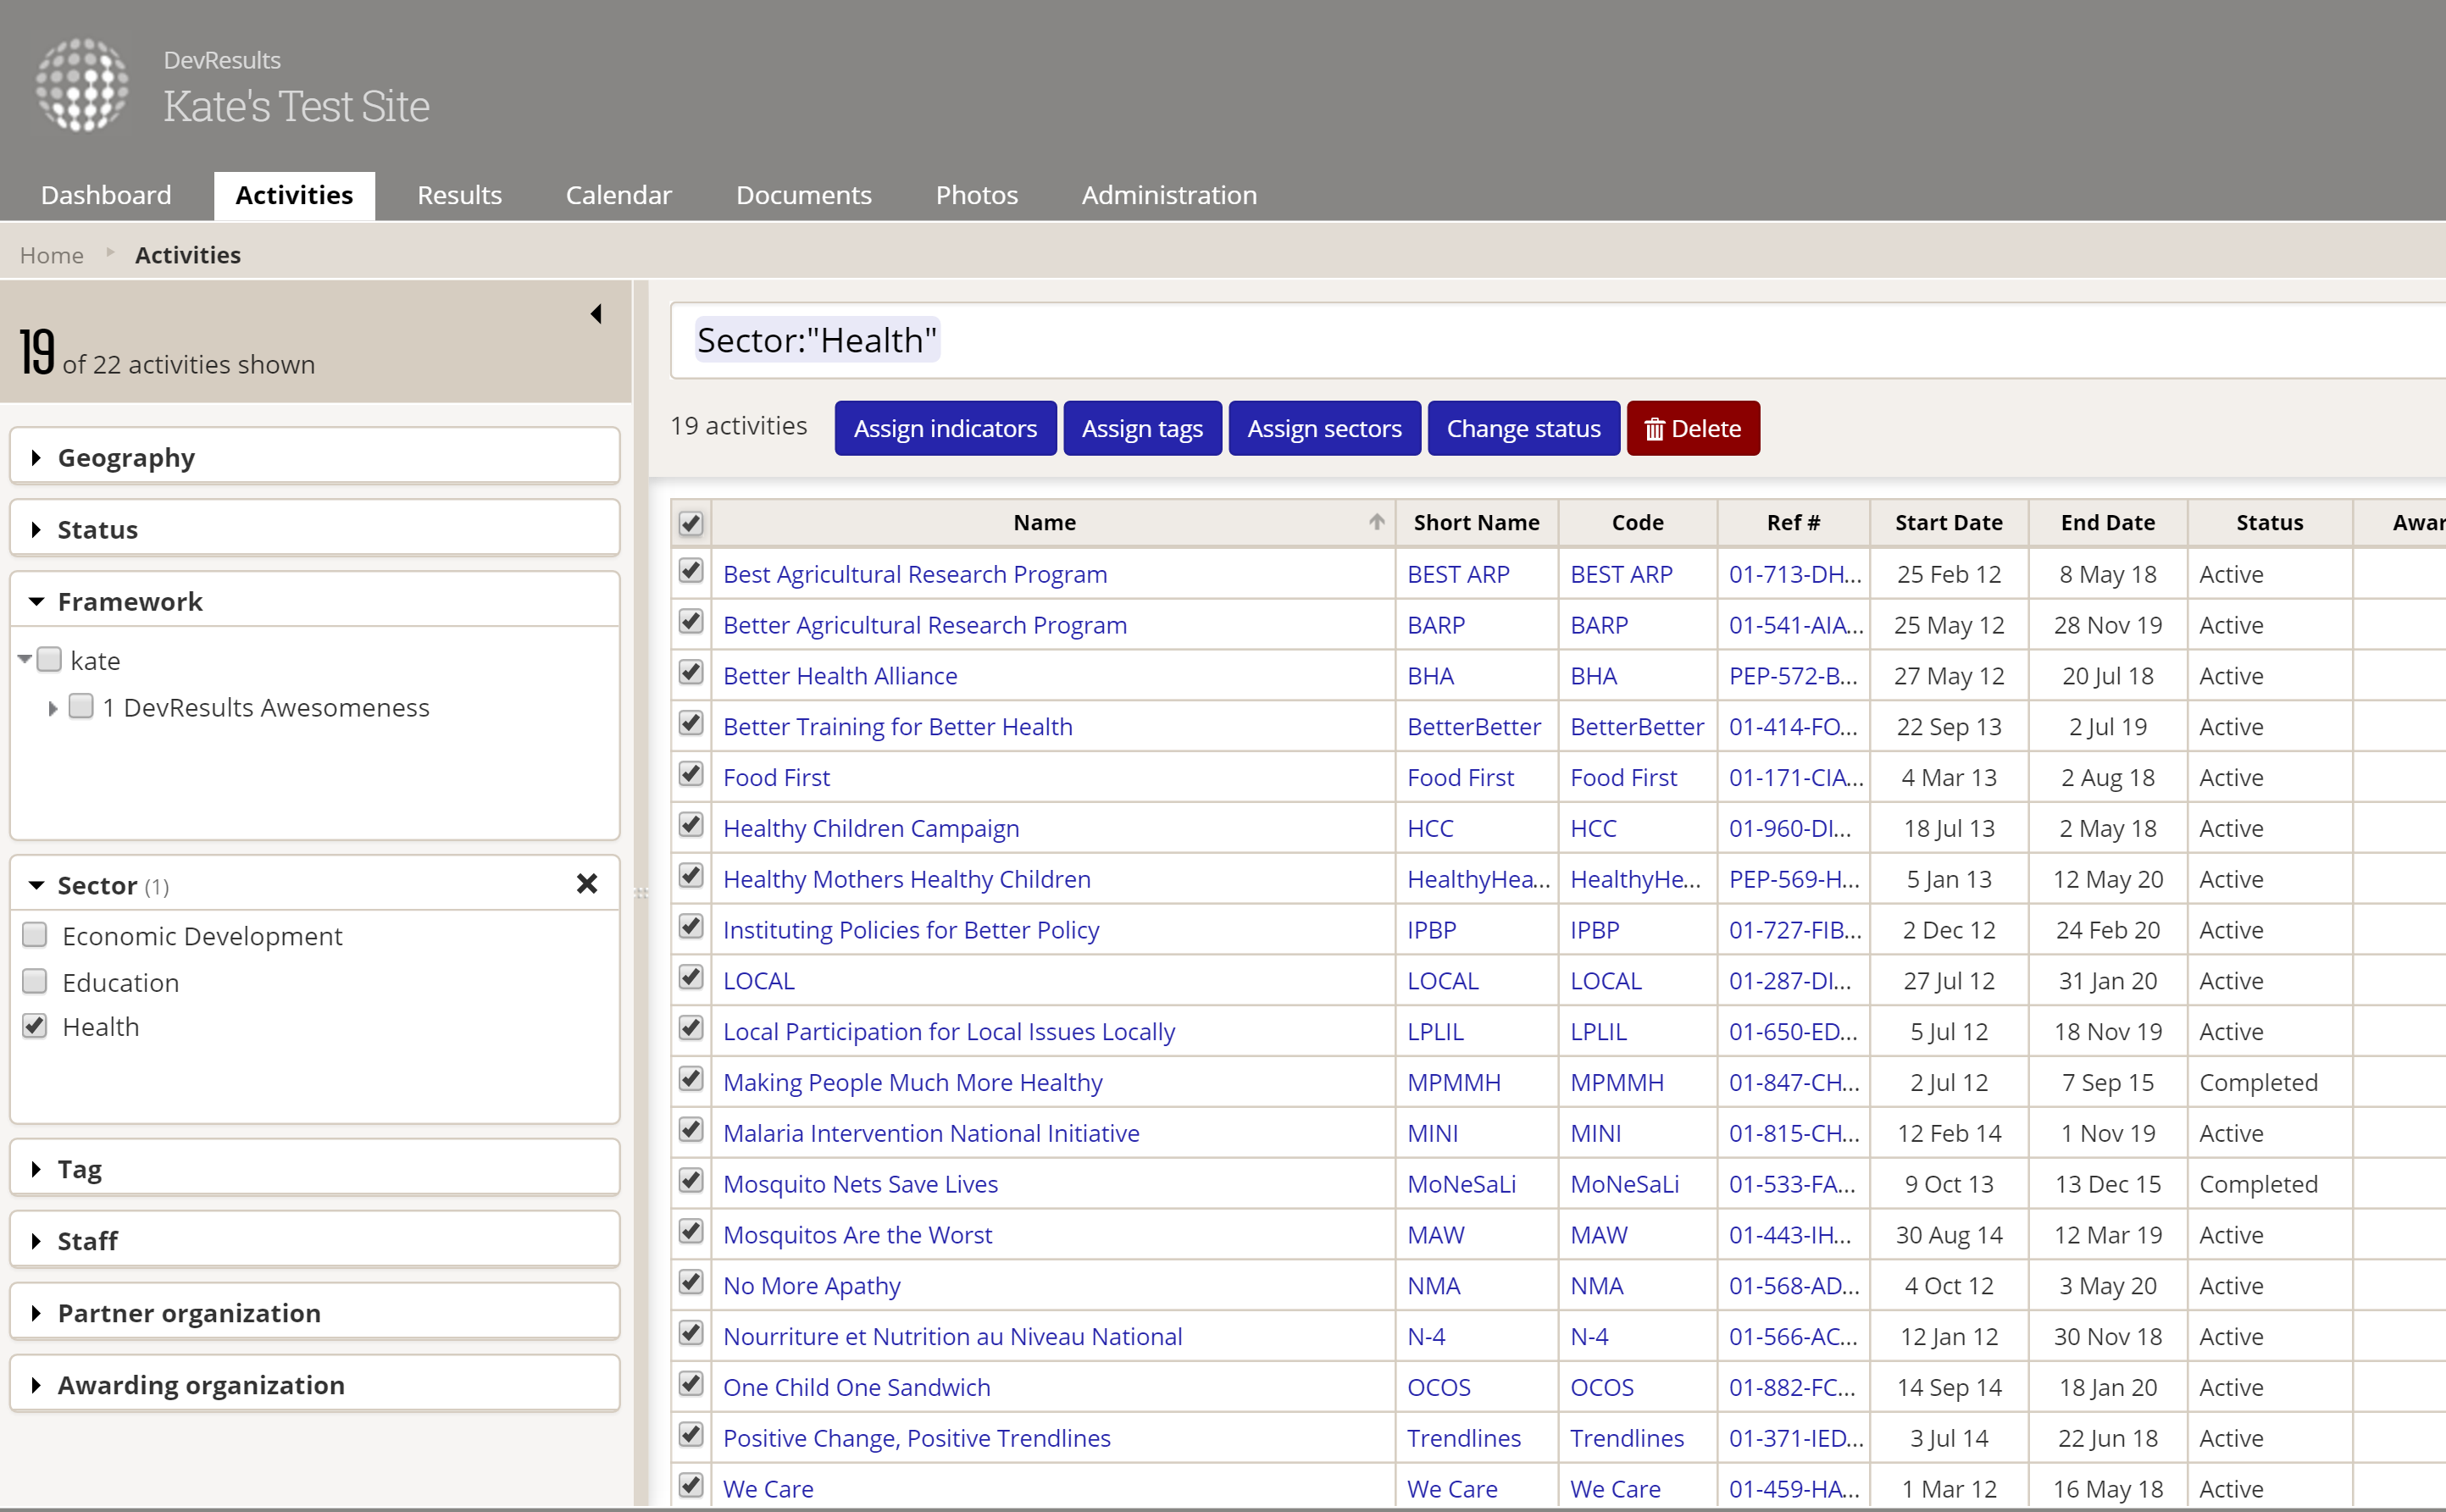
- Click the Assign indicators bulk edit button to open an indicator assignment window.
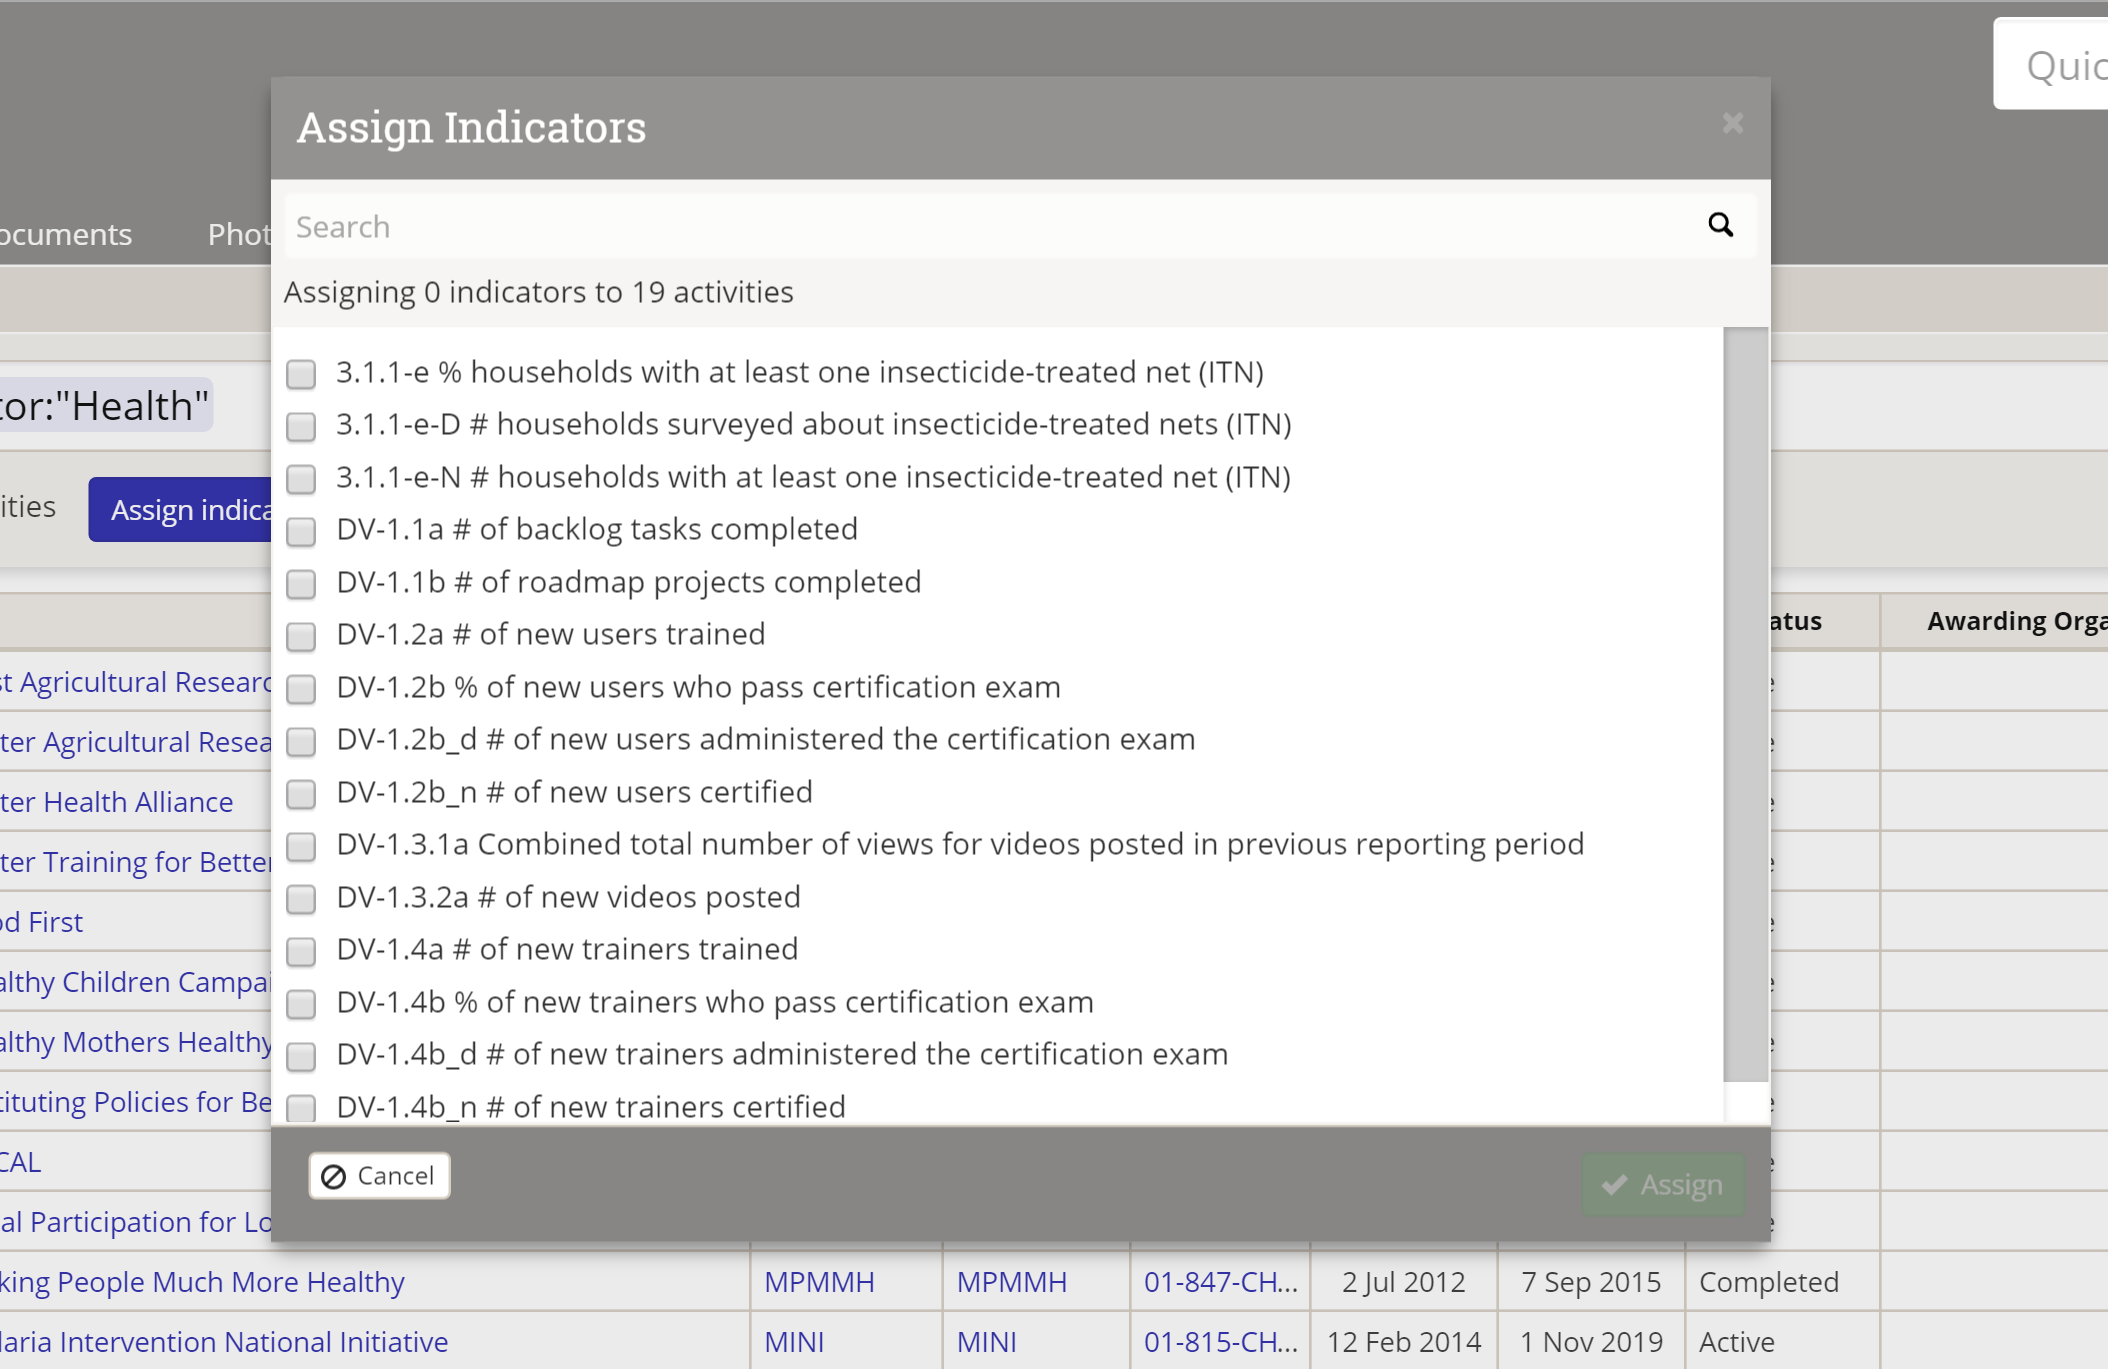
- Search for the three indicators you need and check them off.
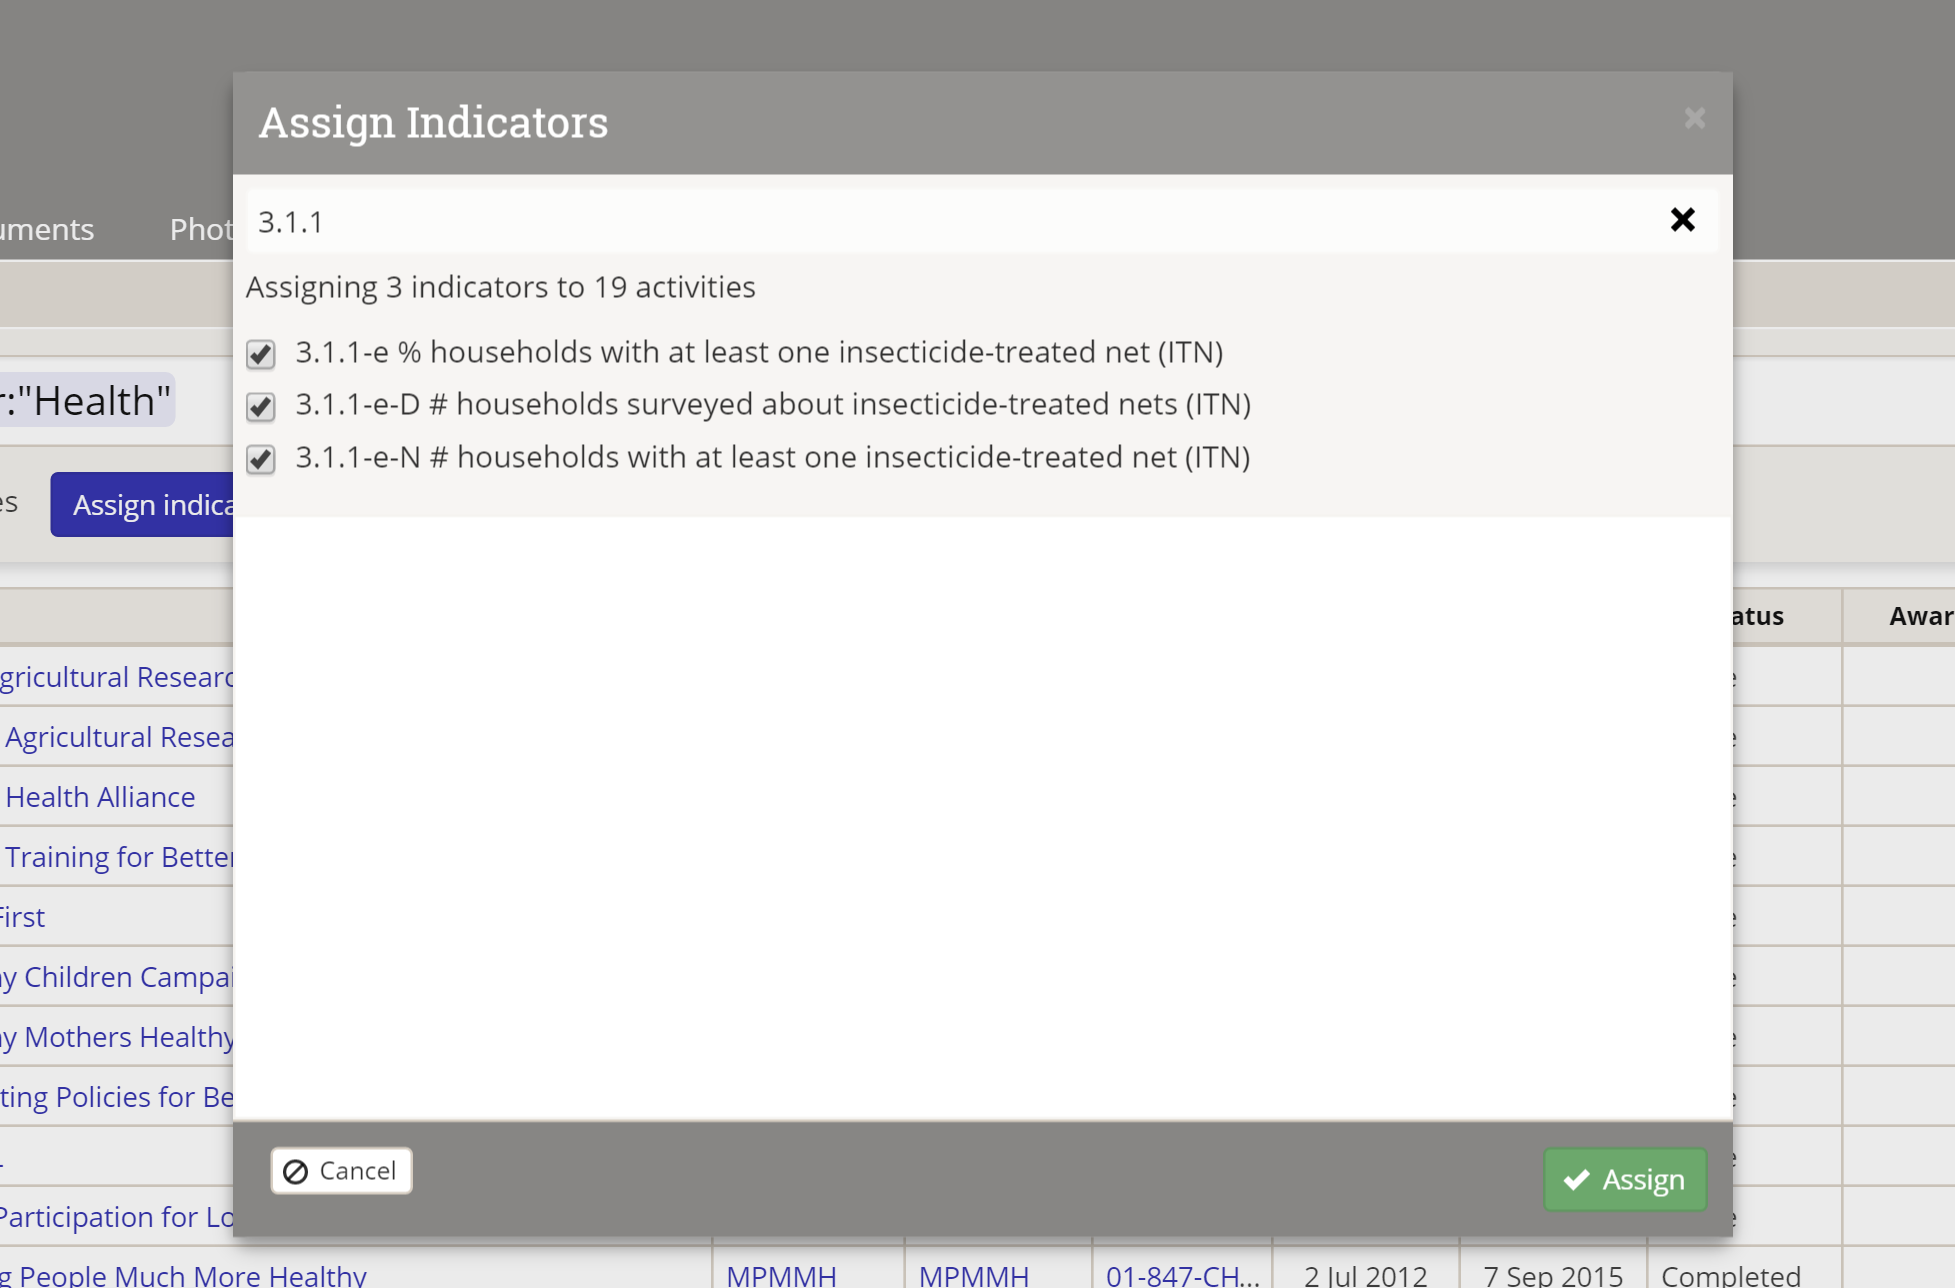
- Click the Assign button in the lower right to assign those 3 indicators to all your Health activities.
And you're done. Perhaps two minutes in total, and you're now totally set for those activities to begin reporting on these new indicators!
See these help pages for more details:
- http://help.devresults.com/help/edit-multiple-indicators
- http://help.devresults.com/help/edit-multiple-activities
Other Changes
1 More Indicator Diagnostics: Calculation Insight
Ever had a formula or data table indicator that didn't seem to be calculating, and you couldn't figure out whether it was a configuration problem or whether there just wasn't any data to be calculated? If so, you'll be happy to have some of the new diagnostics we just released.
Now, every time we automatically try to recalculate formula or data table indicators (or when you manually recalculate them), we log any errors that prevent those indicators from calculating. We're showing them to you in two places:
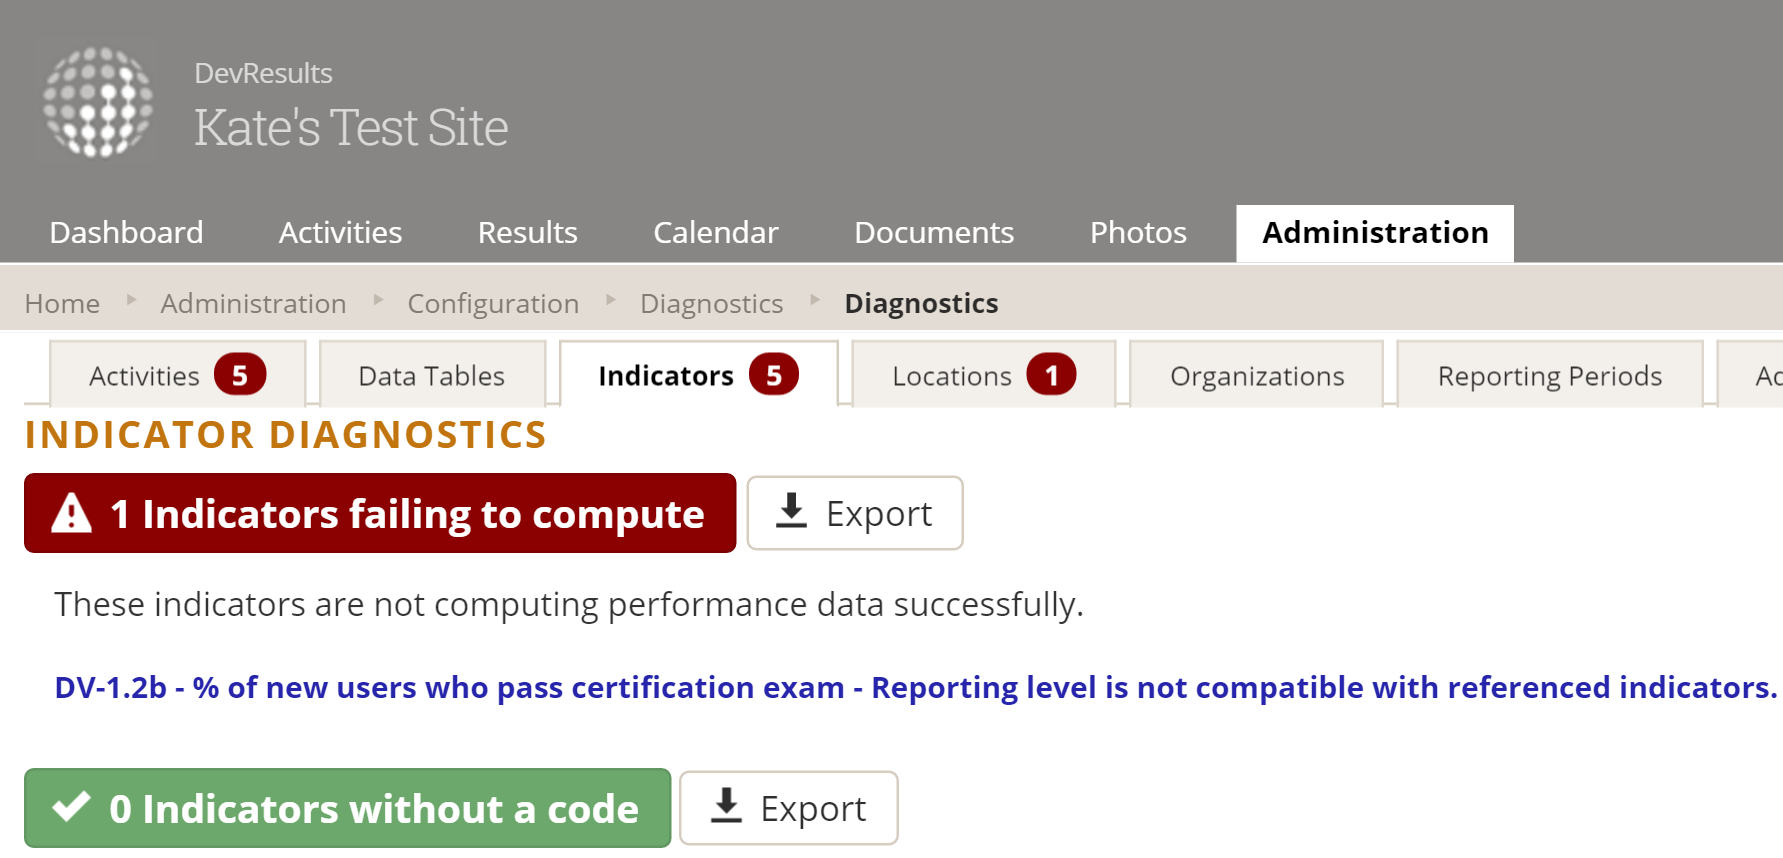
- On the Diagnostics Panel in the Indicators tab:
- At the top of every tab for that individual indicator:

This way, you can instantly know why an indicator isn't calculating and make the configuration changes necessary to get it to calculate! Once you've made changes, you can wait for the indicator to recalculate on our scheduled tasks, or you can just go to the Indicator's Targets & Data tab and click Recalculate results to see if you've fully addressed the problem.
Here are the types of messages you might see here:
Formula Indicators
- The indicator's definition includes a disaggregation that isn't present in all of the referenced indicators. (We'll identify the disaggregation for you.)
- The indicator is cross-disaggregated but at least one referenced indicator is not. (If any referenced indicators are not cross-disaggregated, the formula indicator must be parallel disaggregated to calculate properly.)
- The indicator is marked to report data per activity, but one or more referenced indicators does not report per activity.
- The indicator's formula references one or more deleted indicators.
- The indicator's geographic reporting level is more granular than one or more of the referenced indicator's reporting levels.
Data Table Indicators
- The indicator isn't actually mapped to a data table.
- The indicator is mapped to a data table but has no defined calculation type.
- The indicator has a calculation type defined but no relevant columns assigned for the calculation.
- The indicator has no geography column defined for the calculation.
- The indicator is configured to report per activity but there is no activity column in the mapped data table, so we have no way to calculate data per activity.
- The indicator has no date column configured for it--without a date, we don't know which reporting period to calculate data for!
2 Manage Your DevResults Communication Preferences
Earlier this year, we reached out to key points of contact for all of our client sites to give folks the option to enroll in our beta testing group or to receive advanced notice of major new features. We received good response for this but quickly realized that other users may want access to these notifications as well. We've now moved managing enrollment in these email groups directly into DevResults, so you can have all the control!
To access the settings, simply click on your profile photo or the generic gravatar in the upper right of any DevResults page and click on the Edit Profile link:
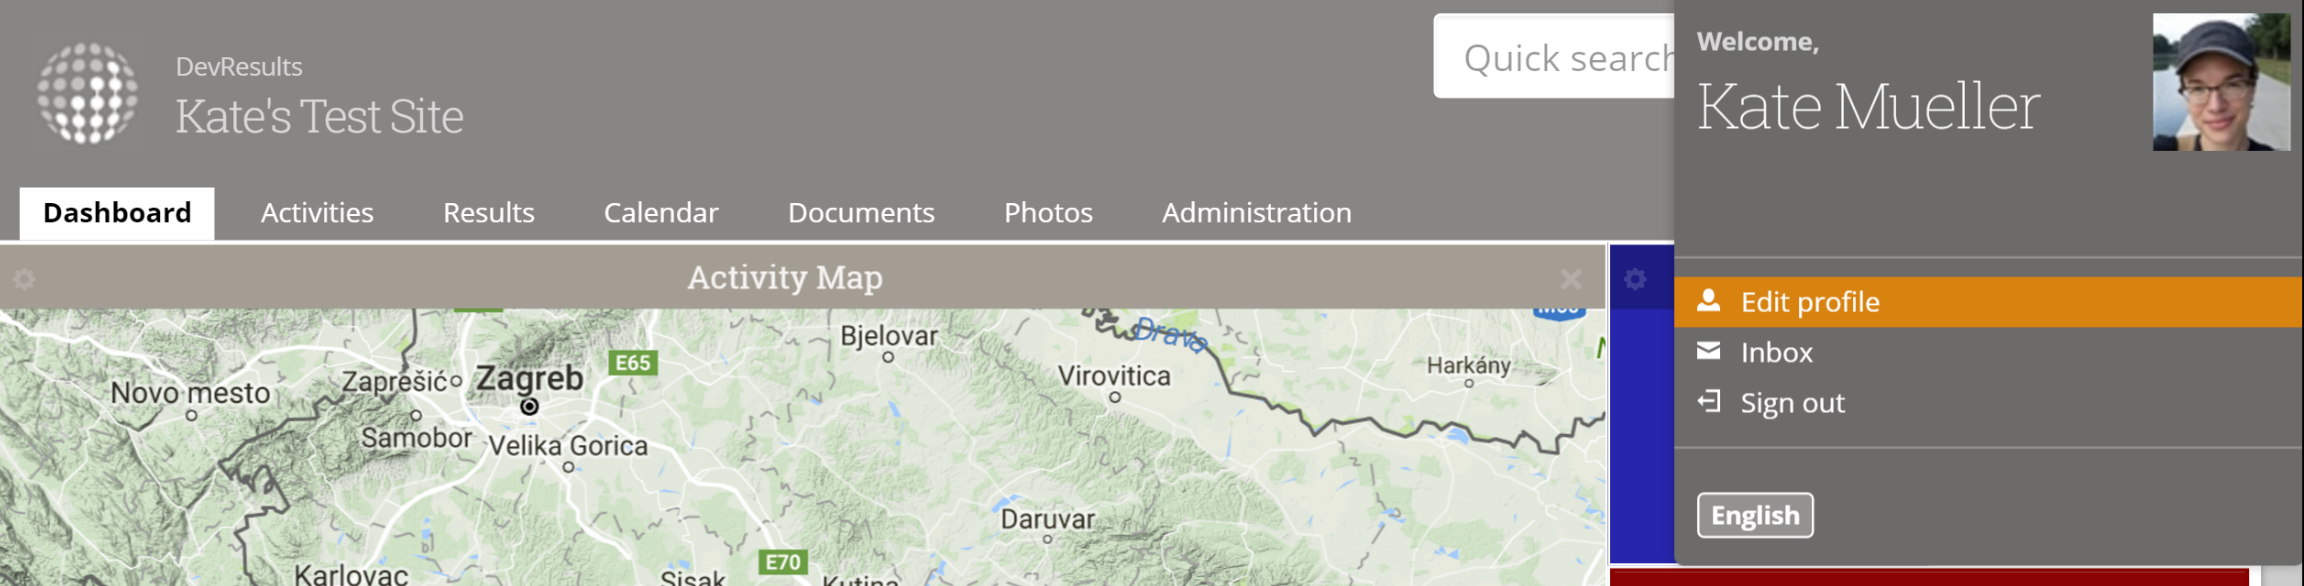 Check out the Additional Communications section to opt in or out of either group:

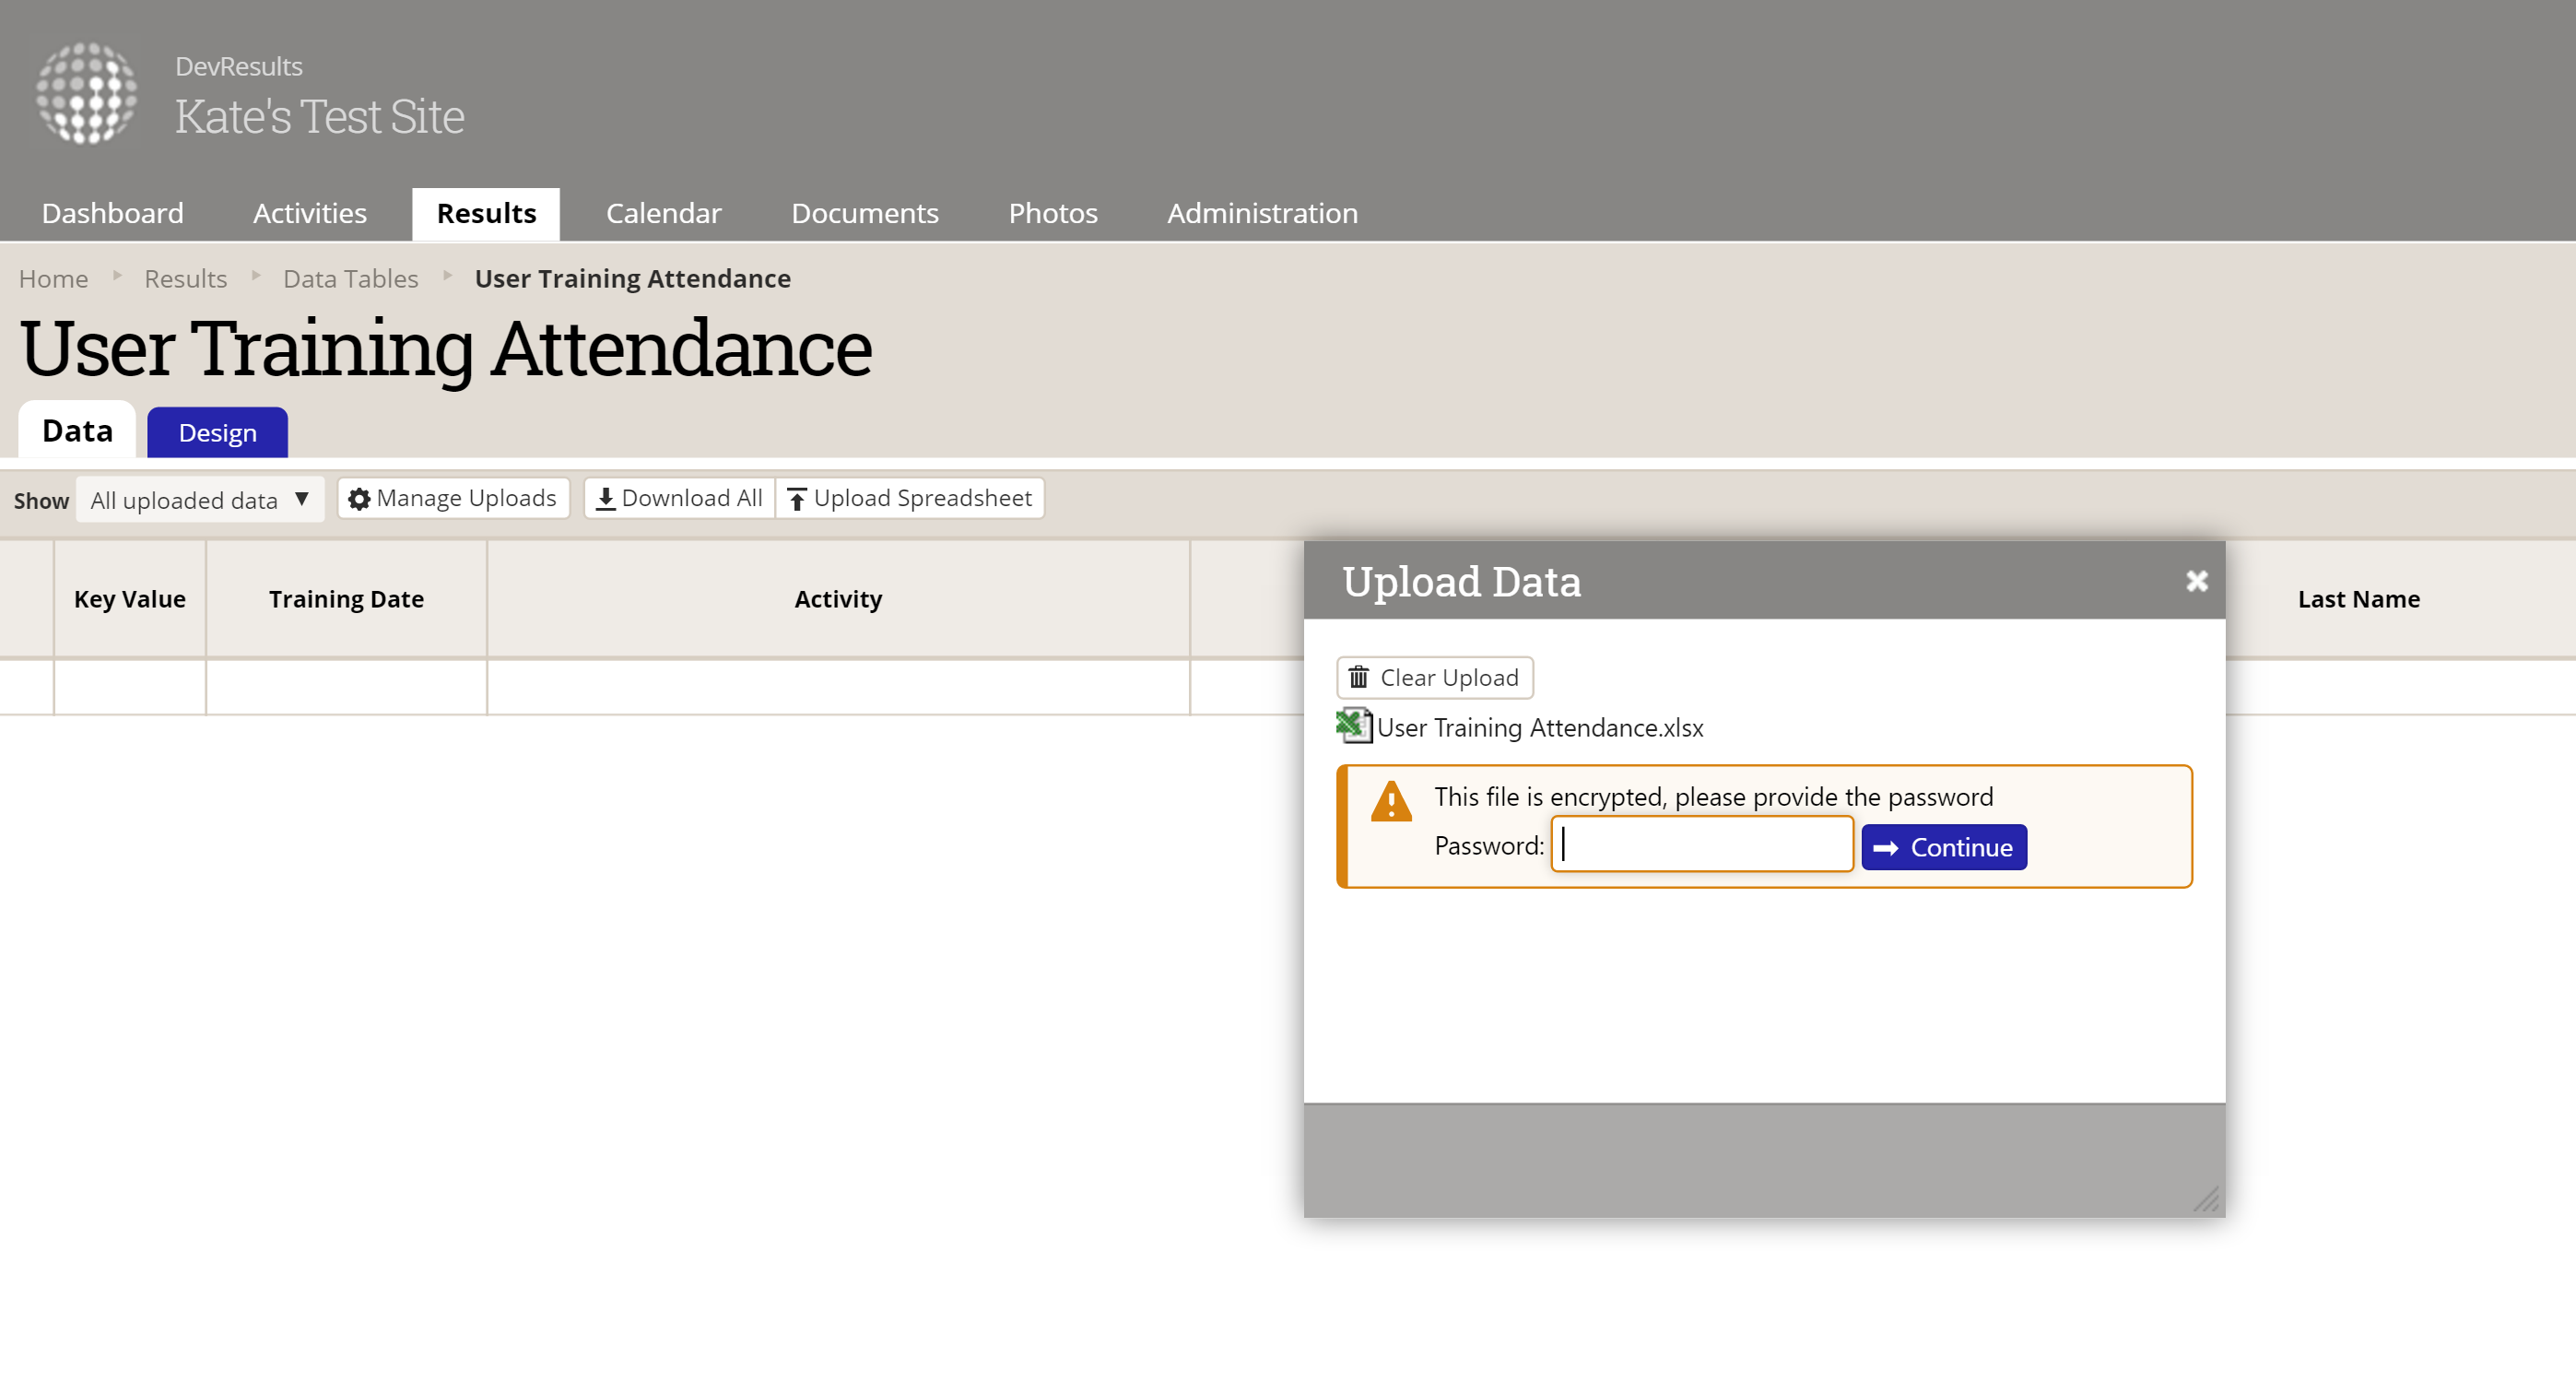
3 Data Table Excel Uploads Support Password-Protected Excel Spreadsheets
For those of you collecting potentially sensitive information in Excel that you want to upload to a data table, this should be one more improvement to streamline you getting that data into DevResults! If you are password-protecting your Excel spreadsheets, we now support uploading them directly into DevResults without having to mess with removing or editing the password.
When you upload a spreadsheet to a data table, DevResults will check to see if the spreadsheet is password-protected. If it isn't, the upload continues as usual. If it is password-protected, we'll prompt you to enter the password for the spreadsheet, check that against the spreadsheet, and upload the data as normal!
4 Faster Activity Reporting Period Template Downloads
We are always striving to improve site performance. In the last couple weeks, we rewrote all the logic that generates the Excel files for Activity Reporting Period data entry. Templates now generate in roughly half the time compared to the old method.
Coming Soon to a DevResults near You
- Updated indicator Targets vs. Actuals chart: now with disaggregations and downloadable!
- Enterprise 2.0 release
Please email us or leave a comment below if you have any questions or feedback on this new feature!