At the start of 2017, we laid out a fairly ambitious roadmap for the year. At a high level, we wanted to increase the usefulness of DevResults beyond the realm of M&E: to make it accessible, usable, and useful for a broader swath of users. To that end, we targeted improvements in two areas: data visualization and granular data collection (data tables). This is the majority of what I laid out in that original blog post. Behind the scenes, we also wanted to increase DevResults' integrations with other systems. In all cases, we wanted to make it easier for DevResults to become part of your organization's way of working, from field data collection to C-suite dashboards.
While we did not deliver 100% of the features I laid out in that original blog post within the calendar year (we're still working on all the data table pieces), we did deliver on all of those goals:
1 New Dashboards
By far the centerpiece of 2017's accomplishments, we released a new Dashboard Layout Manager, which sports all-new dashboard tiles, a smoother and more intuitive layout editing experience, multiple dashboards, and shareable dashboards.
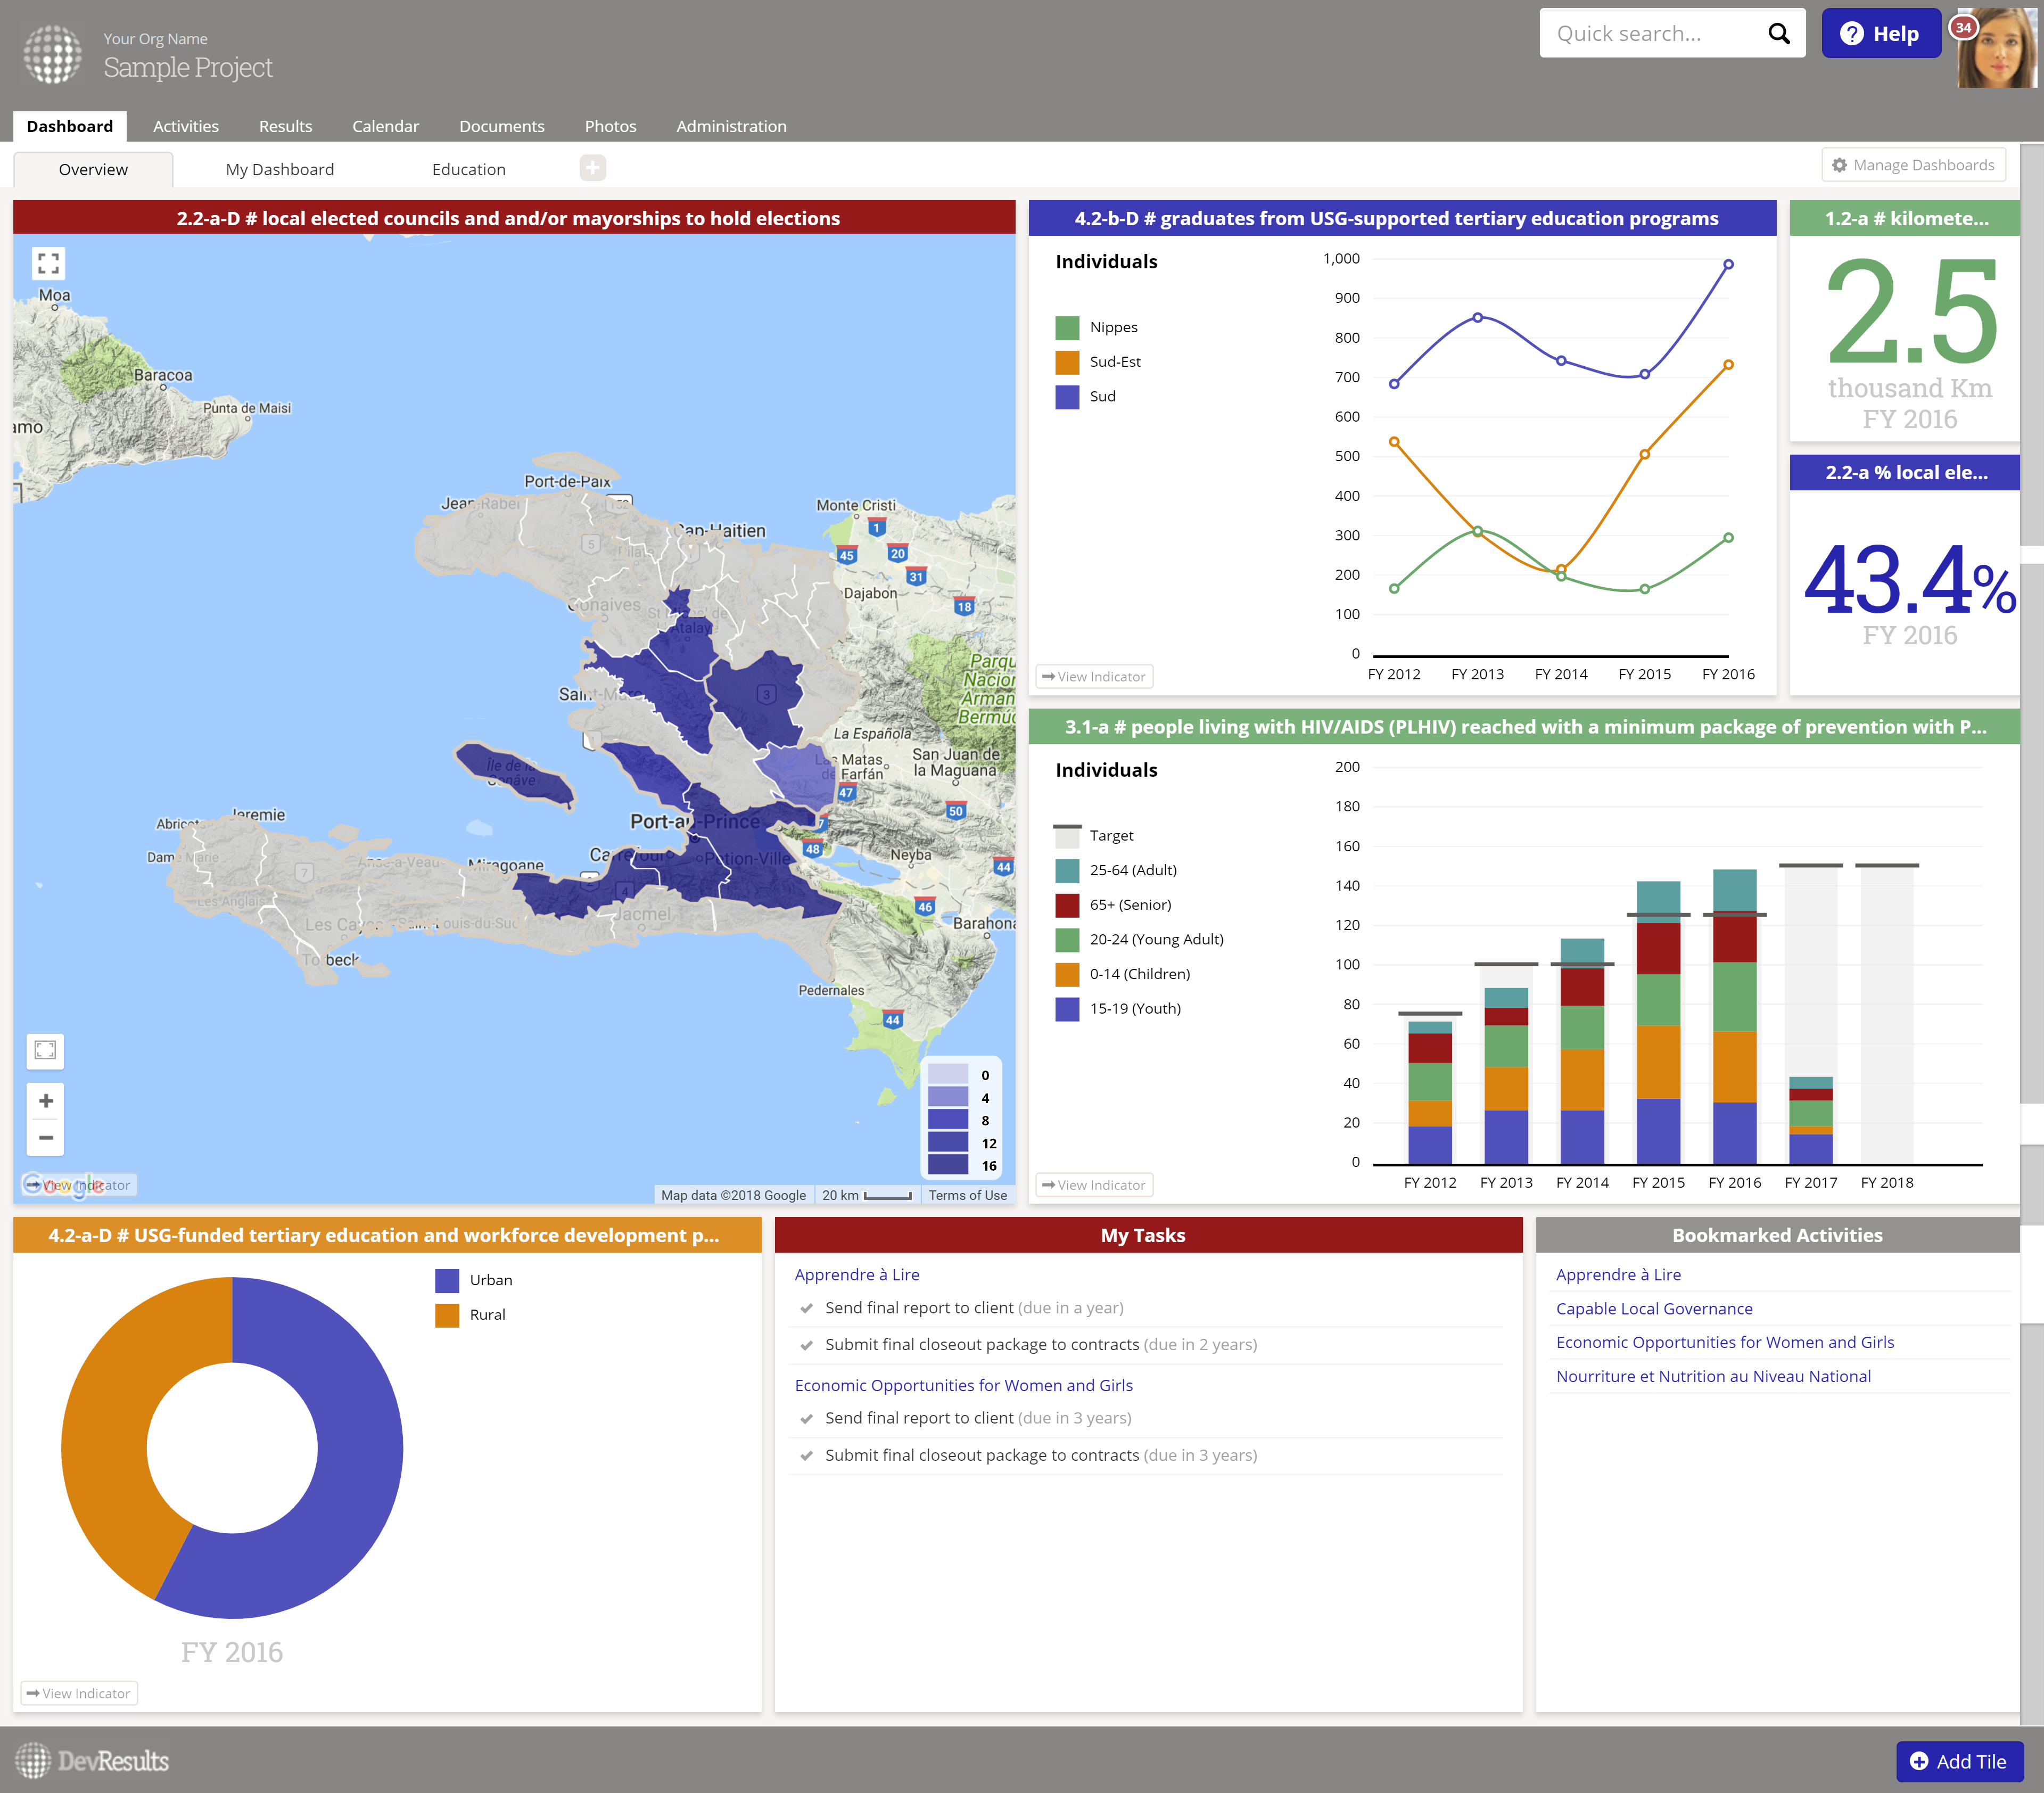
This takes our dashboards to a new level, making them fast and easy to create and share, so they can function more as shared resources for showing to your internal teams, department heads, executives, and donors. Plus, with the new configuration options made available in all the new visualization tiles, you can much better filter and format these to present exactly the data you want to showcase.
For more info on how to use our new dashboards, check out these knowledge base articles: Edit a Dashboard, Site Default Dashboard, and Pushing Dashboards to Other Users.
2 New Indicator Visualizations + Configuration Panel
As part of the upgrade to our dashboards, we also overhauled every existing dashboard tile, which included rewriting every indicator visualization we had (and exposing some new ones). This added visualizations to the Indicator Reports tab and led to the creation of the visualization left-hand configuration panel, which allows you to Recalculate, Download, Filter, and Configure your visualization to your tastes.
 In the past, we didn't really expose many configuration options in the Indicator Reports tab, and each visualization had a different configuration experience. This change updated our visualizations to newer, more interactive technologies, but we also used the opportunity to provide a consistent configuration experience across visualizations. (Spoiler: we hope to leverage this same pattern in our 2018 Pito rewrite!)
3 Data Table Row Locking
Our Activity Reporting Period submission and approval process has provided a trusted way to lock direct entry indicator data, but we lacked the same kind of locking mechanism for data table data. We released data table row locking in February 2017. It examines the indicators tied to a data table, determines which activity reporting period the rows for those indicators relate to, and will lock rows from editing or deletion if they fall within closed reporting periods.
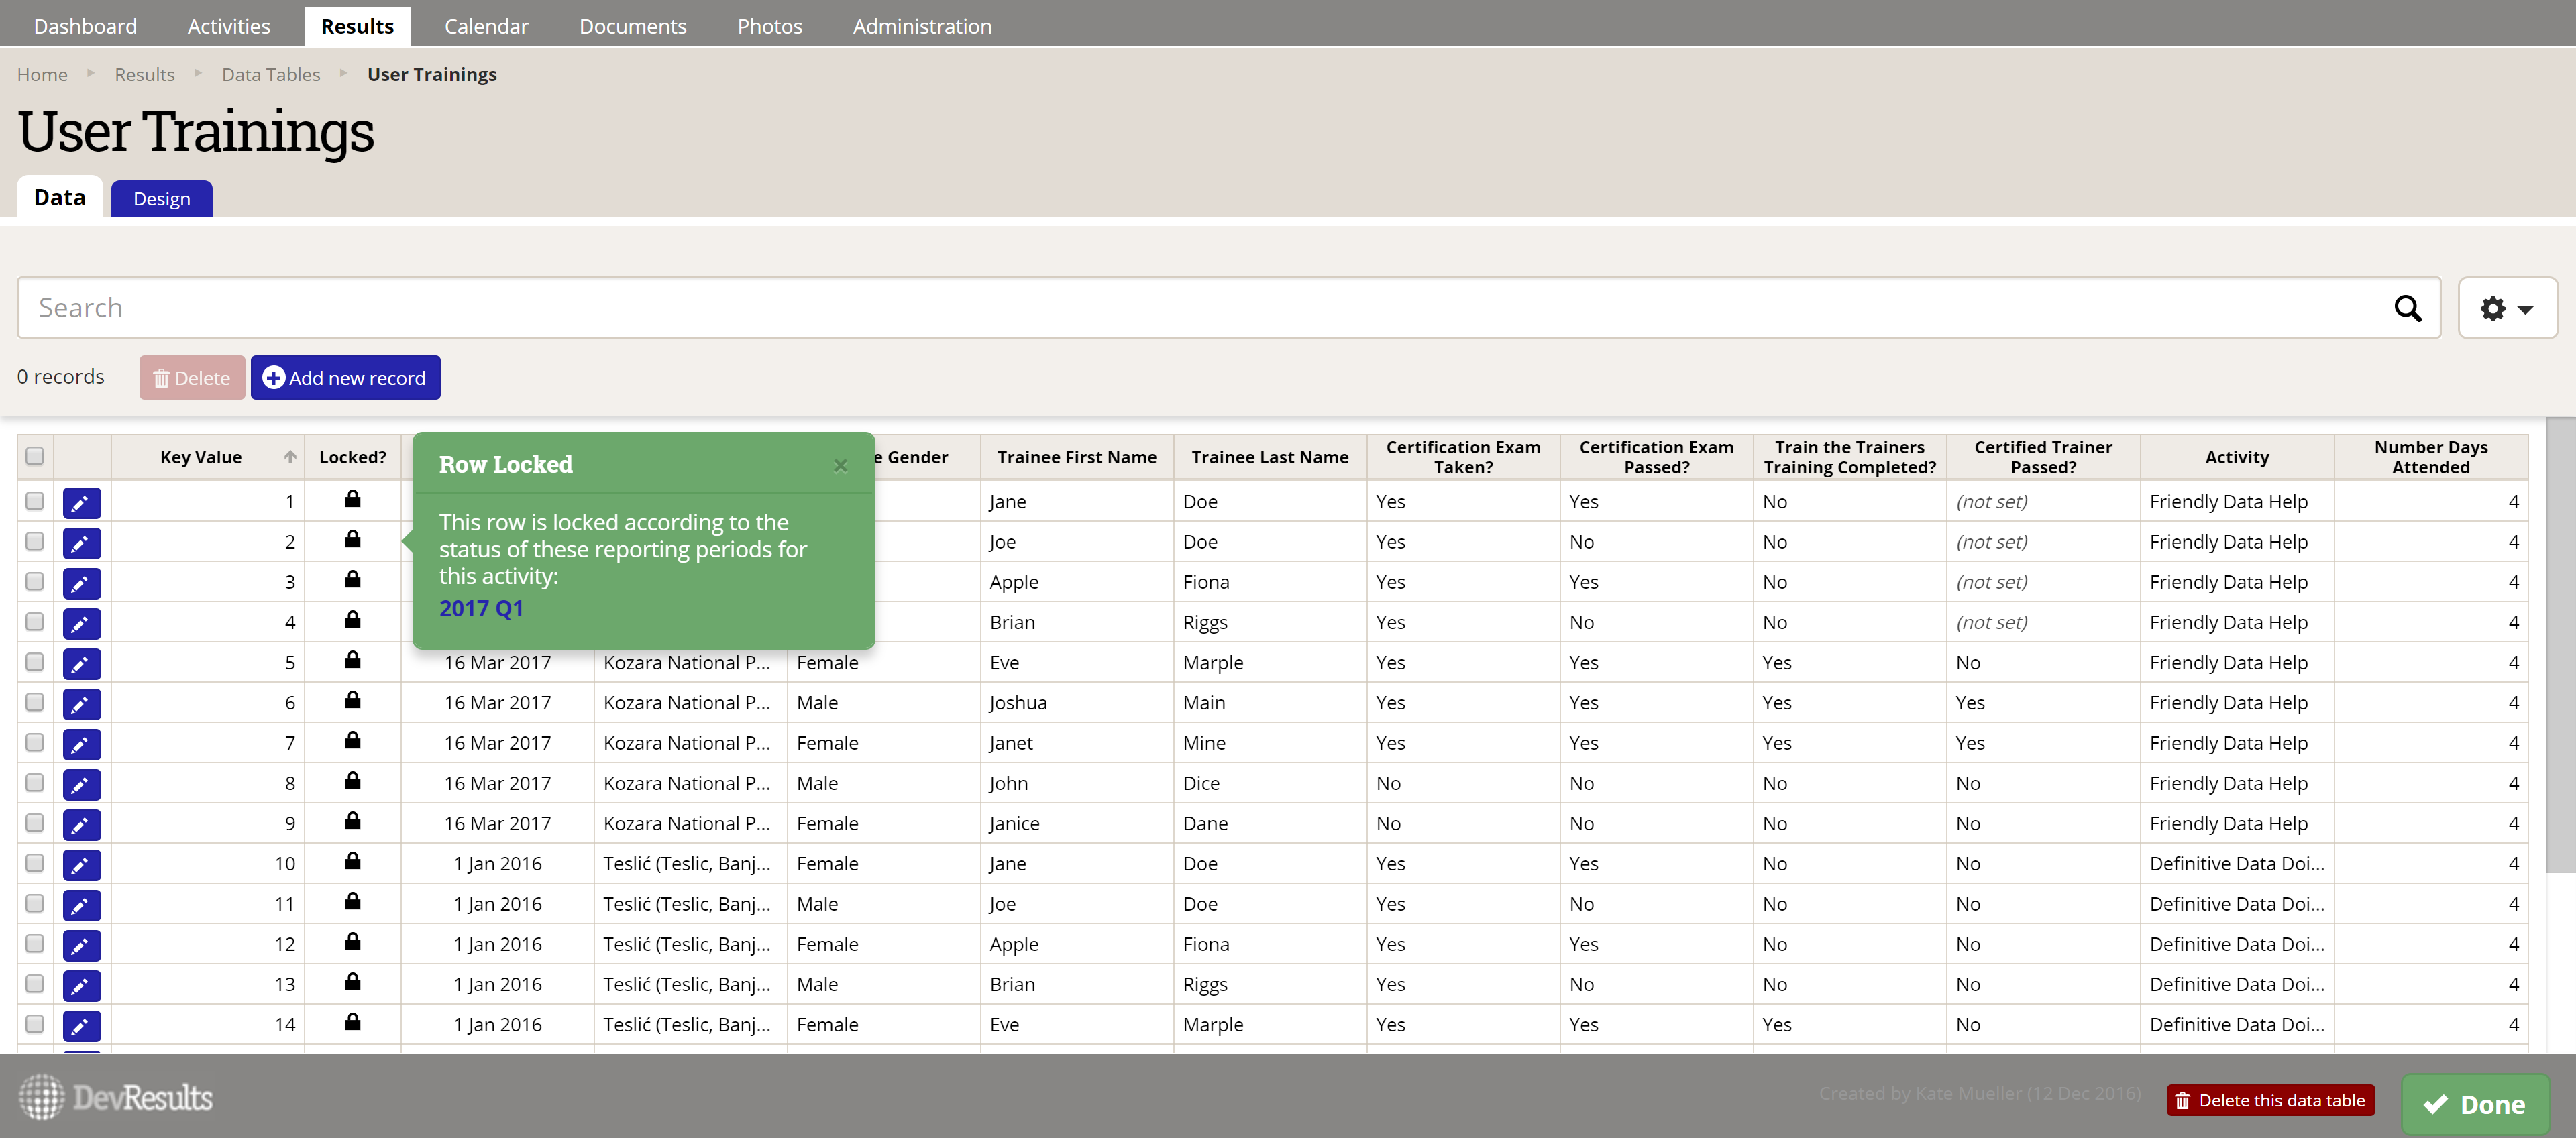 Previously, direct entry indicator data would be locked but data table rows could be edited at any time. Data table row locking basically extends that same data reliability to data tables.
For more info on data table row locking, check out these knowledge base articles: Data Table Row Locking and Data Submission and Approval Process.
4 IATI
Central to DevResults' philosophy on technology, as well as our business model, are the principles of interoperability, collaboration, and transparency. To focus our efforts on a practical solution, we added IATI compatible exports in March 2017. IATI is quickly becoming a standard for organizations working in or funded by European organizations.
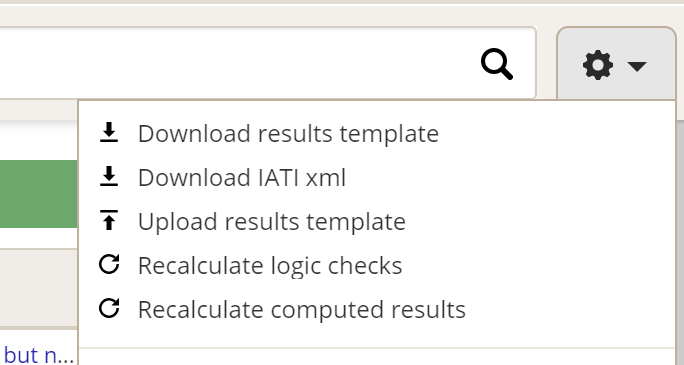 This was our first foray into IATI requirements; currently, we've enabled exports for a single activity/single reporting period and for all activities for a single reporting period. We look forward to your feedback as to what other IATI exports or additional data platform integrations you'd find helpful.
For more info on IATI, check out this knowledge base article: IATI Export.
5 Single Sign-on
DevResults is increasingly supporting not just single project or portfolio teams, but entire organizations. As a result, we've made it easier to play nice with your identity management systems and other tools you might be using. In June, we released Single Sign-On integration. This integration has helped simplify user management for many clients. It allows you to establish a connection between DevResults and your existing Active Directory Single Sign-on management, so that logging into DevResults uses those credentials. This keeps the number of passwords your users need to know to a minimum. It has the added benefit of designating a default group for all new users who log into DevResults using SSO access, so you'll spend less time creating new user accounts and managing permissions. Currently, we support SSO with Azure Active Directory and Active Directory via OAuth2.
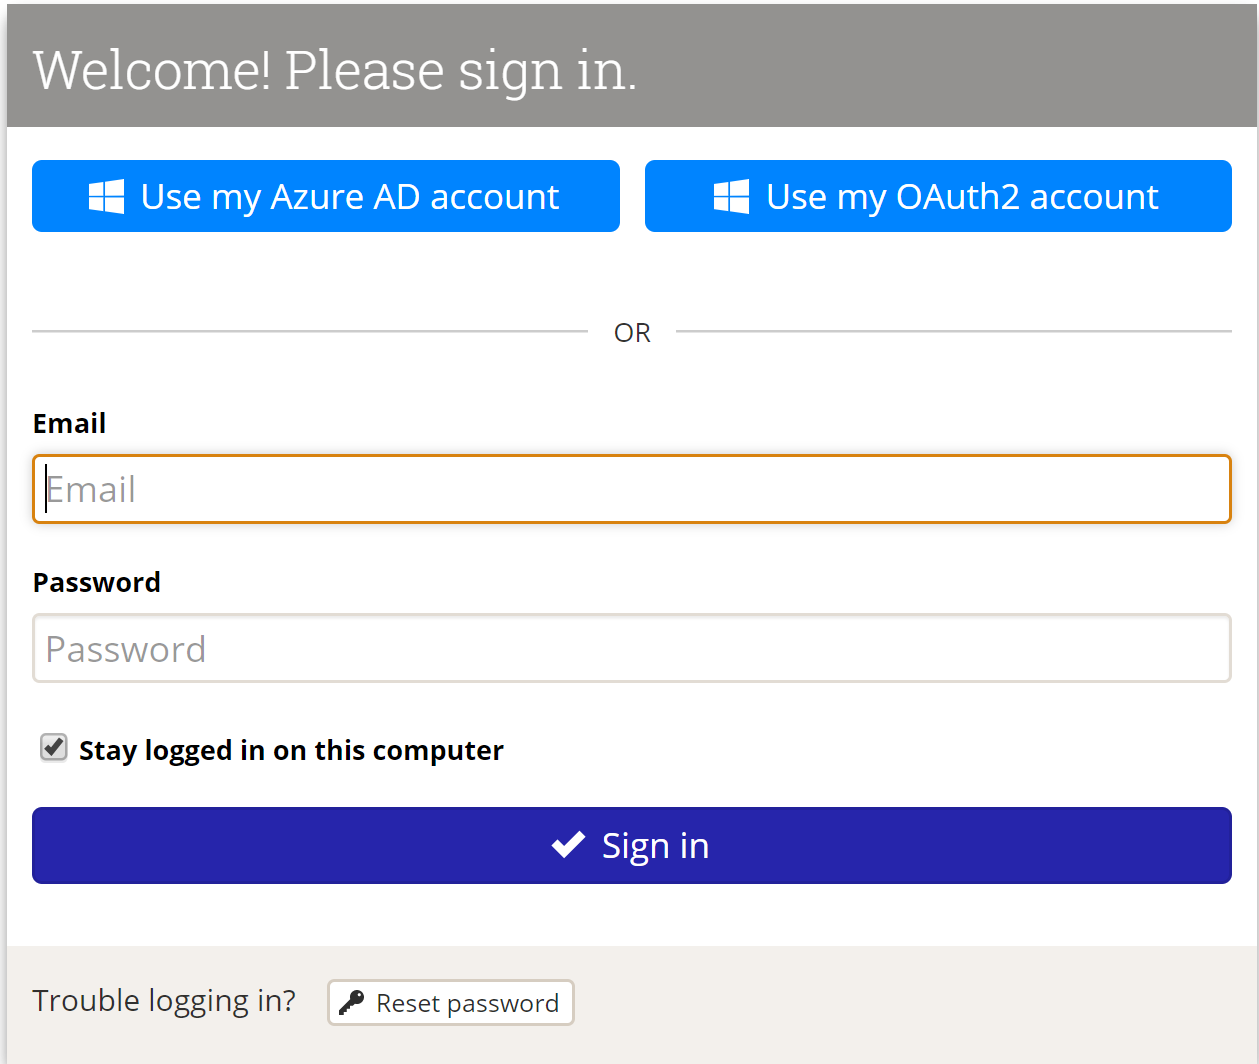
For more info on Single Sign-On, check out this knowledge base article: Integrating Single Sign-On.
6 Data Table Rewrite
By now you'll have seen our Upgrades to Data Tables. Most of the work for this release was completed in Q4 of 2017, so while I can't tout it as a true 2017 release, it's what we worked on around the end of the year. This work updated the technology stack we use for data tables, which has laid the groundwork for even more exciting changes in 2018.
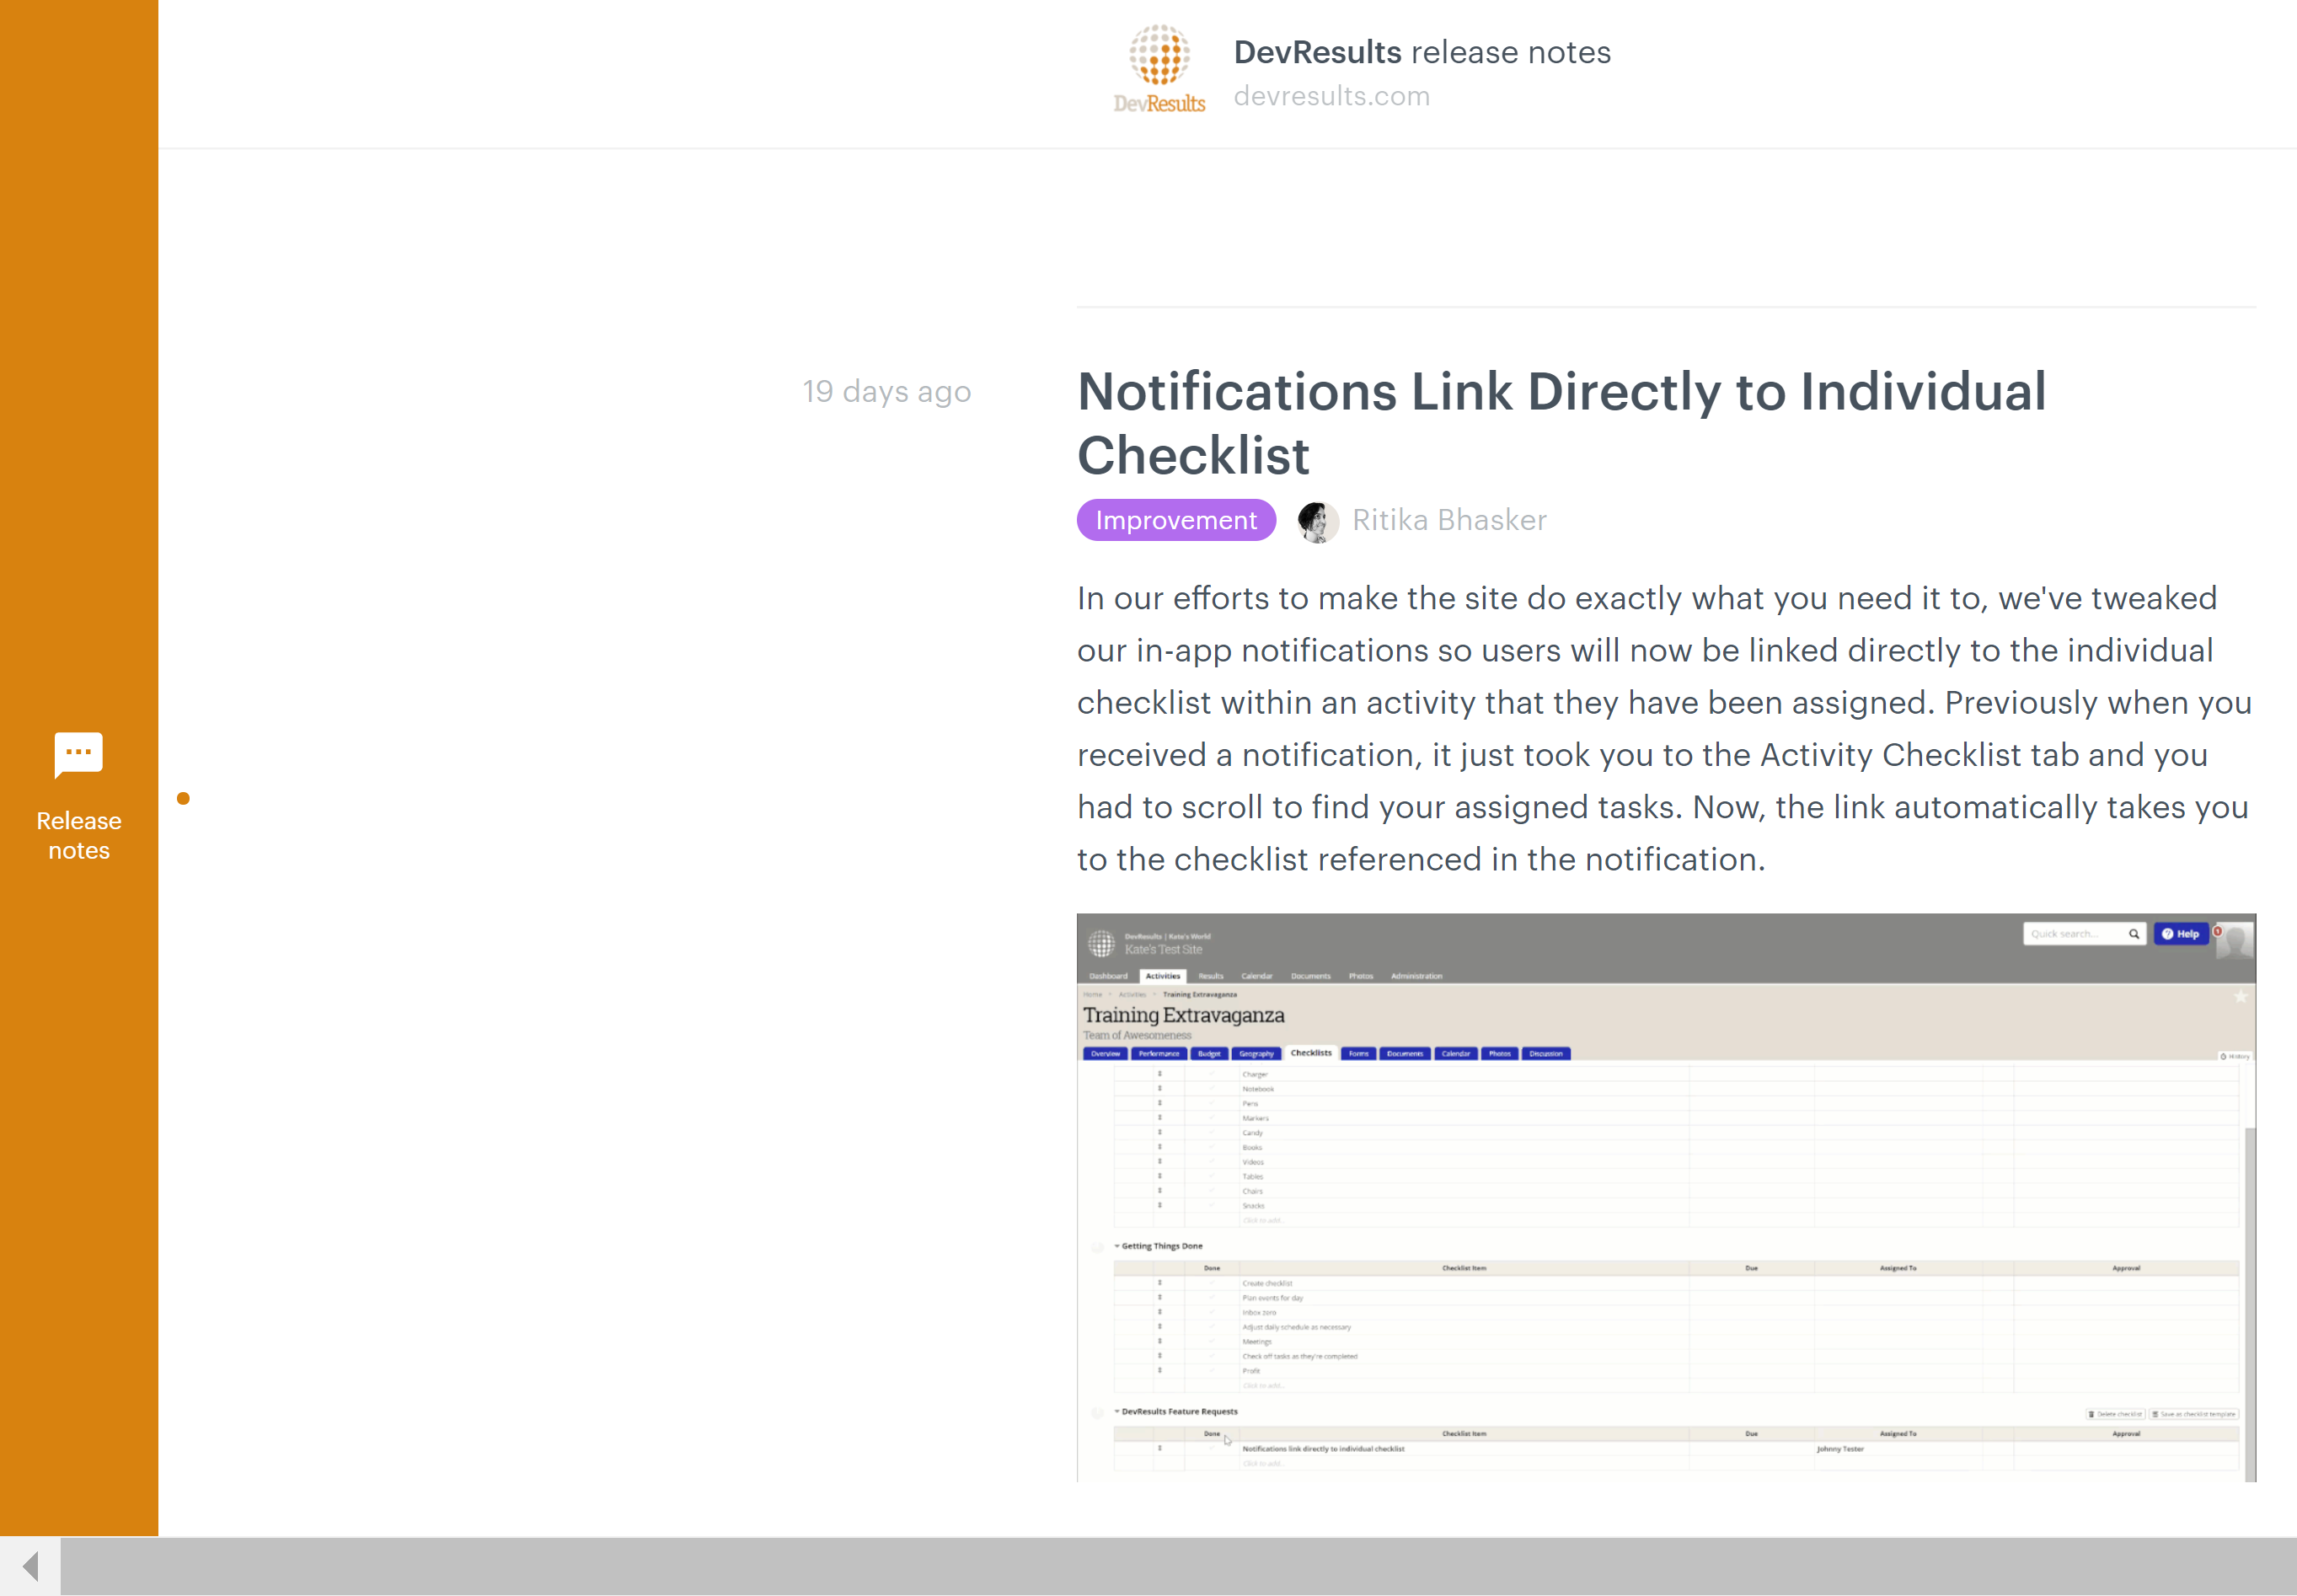
7 Release Notes
Small but noteworthy, in 2017 we streamlined the ways we communicate software improvements to you. Beta and feature releases have continued to appear in individual blog posts, but for the small changes we make all the time, we added a new communication method: Release Notes. This allows us to easily document and share small tweaks and improvements to the software as soon as they happen, rather than having to collect a bunch of them into a round-up blog post once a month. You can access Release Notes from within the Help menu at the top of every DevResults page. If you haven't noticed these yet, go check them out!
Final Thoughts
This is the third annual retrospective I've written, and looking back, I am the most proud of our team's planning and execution in 2017. We've made our aspirational roadmaps available for two years now (2016 and 2017) and of these, we were far more successful at delivering progress toward every single goal in 2017.
More importantly, we also tested a new way of involving more users in changes as we write features.
The new visualizations and dashboards marked the first time that we've ever run beta testing of new features live next to the same existing features. We received amazing detailed feedback from beta testers throughout that process.
We got so much feedback from this process that we updated and built things we hadn't anticipated. This took longer (sorry, data table fans), but it also made the new visualizations and the new dashboard even more useful for more users. We hope to build on this kind of collaborative experience for major releases moving forward.
As part of that, I'd like to give a huge shout-out to all of the users who participated in our beta testing program of the new dashboards and the indicator visualizations. Some of you responded through our beta testing emails; others opened help tickets with questions or suggestions on the new visualizations' behavior. You might not have even thought of yourself as a tester, but you were.
Every one of you has helped make DevResults do more and be a better product. We know that takes time and energy, and we want you to know how much we appreciate it. User feedback drives all of the improvements we make, so please continue helping us make DevResults better. We hope it's been fulfilling seeing problems or changes you told us about getting addressed!
On a personal reflective note, I am stepping down from my position at DevResults to thru-hike the Appalachian Trail this year, so this will be my last annual retrospective for the foreseeable future. It has been an amazing adventure, and I am incredibly proud of the changes we've made during my tenure. I know that 2018 holds even more fantastic improvements for us, and we'll soon be posting our 2018 roadmap so you can see those in more detail!